\n
## Line Chart: ARC-C Performance Evaluation
### Overview
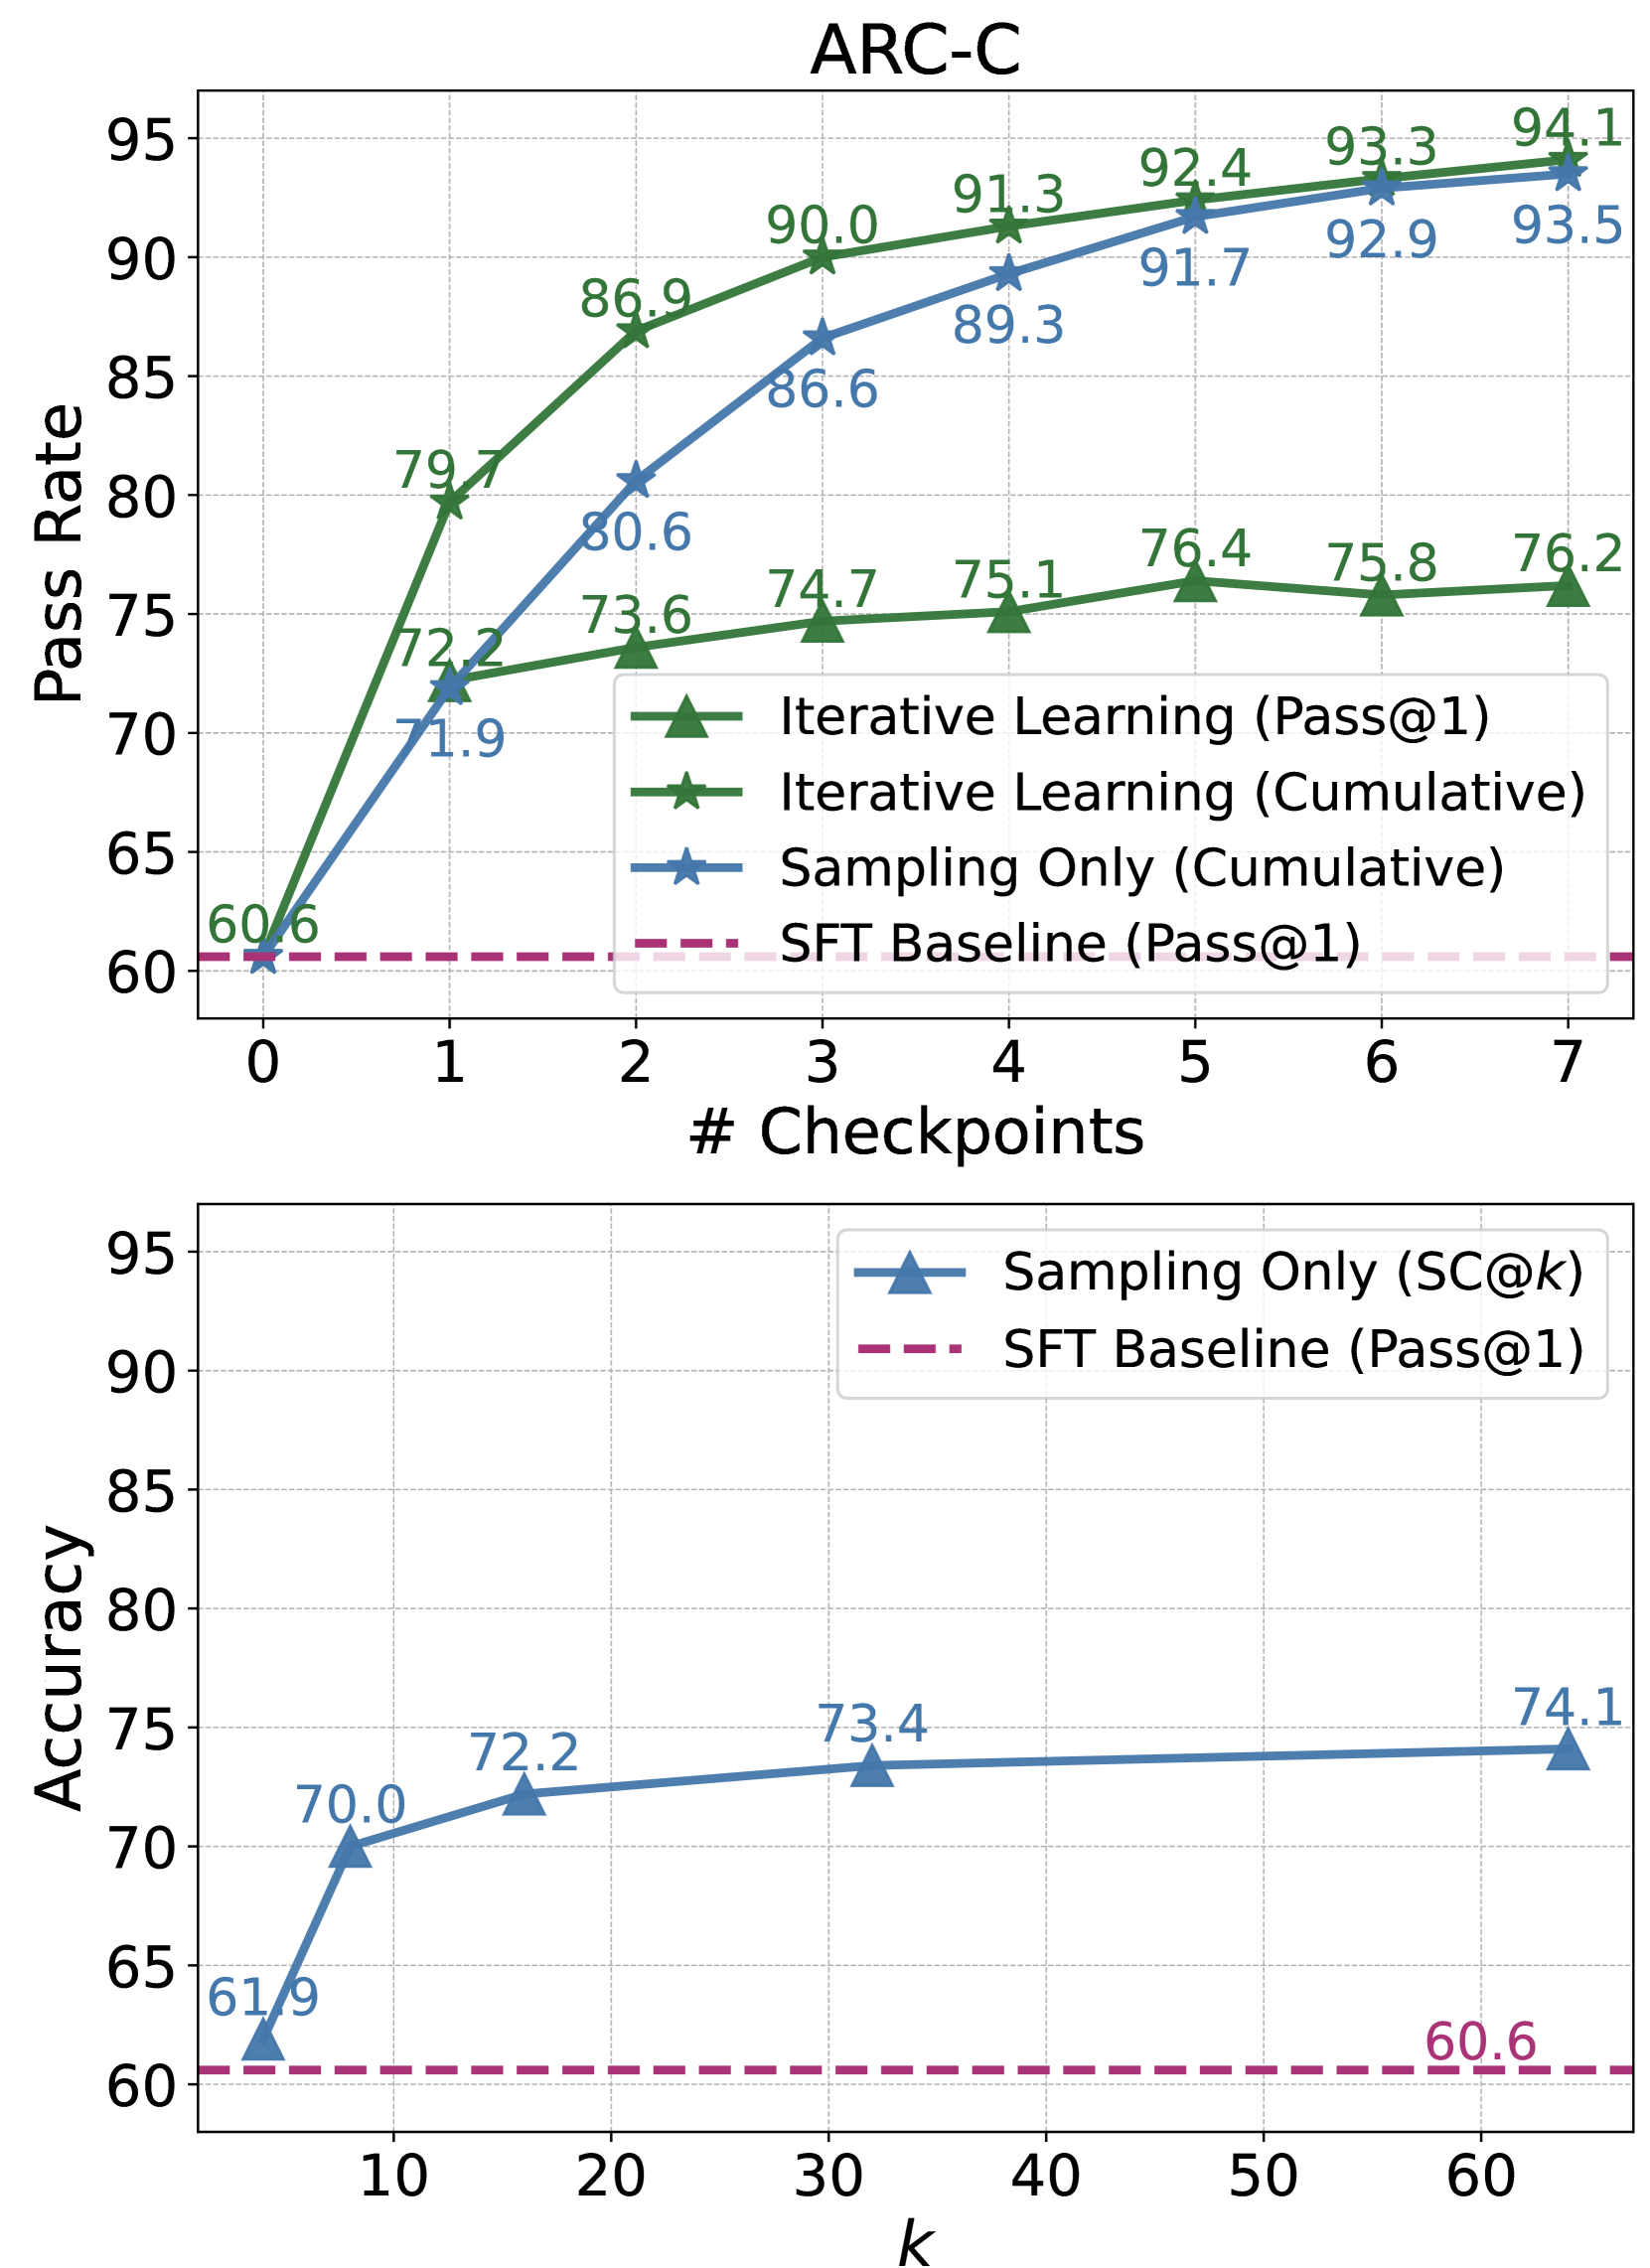
The image presents two line charts evaluating the performance of different learning strategies (Iterative Learning and Sampling Only) against a Supervised Fine-Tuning (SFT) Baseline. The top chart focuses on "Pass Rate" as a function of "# Checkpoints", while the bottom chart displays "Accuracy" as a function of "k". Both charts aim to demonstrate the effectiveness of the iterative and sampling approaches in improving model performance.
### Components/Axes
**Top Chart:**
* **Title:** ARC-C
* **X-axis:** "# Checkpoints" (ranging from 0 to 7, with tick marks at each integer value)
* **Y-axis:** "Pass Rate" (ranging from 60 to 95, with tick marks at intervals of 5)
* **Legend:**
* "Iterative Learning (Pass@1)" - Green line with triangle markers
* "Iterative Learning (Cumulative)" - Blue line with circle markers
* "Sampling Only (Cumulative)" - Red line with star markers
* "SFT Baseline (Pass@1)" - Dashed red line
**Bottom Chart:**
* **X-axis:** "k" (ranging from 10 to 60, with tick marks at intervals of 10)
* **Y-axis:** "Accuracy" (ranging from 60 to 95, with tick marks at intervals of 5)
* **Legend:**
* "Sampling Only (SC@k)" - Blue line with circle markers
* "SFT Baseline (Pass@1)" - Dashed red line
### Detailed Analysis or Content Details
**Top Chart:**
* **SFT Baseline:** The dashed red line remains relatively constant at approximately 60.6 across all checkpoints.
* **Iterative Learning (Pass@1):** Starts at 60.6 at 0 checkpoints, rises sharply to 79.7 at 1 checkpoint, then continues to increase, reaching 94.1 at 7 checkpoints.
* **Iterative Learning (Cumulative):** Starts at 71.9 at 0 checkpoints, increases to 80.6 at 1 checkpoint, then rises to 93.5 at 7 checkpoints.
* **Sampling Only (Cumulative):** Starts at 60.6 at 0 checkpoints, increases to 72.2 at 1 checkpoint, then rises to 93.5 at 7 checkpoints.
**Specific Data Points (Top Chart):**
* Checkpoint 0: Iterative (Pass@1) = 60.6, Iterative (Cumulative) = 71.9, Sampling (Cumulative) = 60.6
* Checkpoint 1: Iterative (Pass@1) = 79.7, Iterative (Cumulative) = 80.6, Sampling (Cumulative) = 72.2
* Checkpoint 2: Iterative (Pass@1) = 86.9, Iterative (Cumulative) = 86.6, Sampling (Cumulative) = 73.6
* Checkpoint 3: Iterative (Pass@1) = 90.0, Iterative (Cumulative) = 89.3, Sampling (Cumulative) = 74.7
* Checkpoint 4: Iterative (Pass@1) = 91.3, Iterative (Cumulative) = 89.3, Sampling (Cumulative) = 75.1
* Checkpoint 5: Iterative (Pass@1) = 92.4, Iterative (Cumulative) = 91.7, Sampling (Cumulative) = 76.4
* Checkpoint 6: Iterative (Pass@1) = 93.3, Iterative (Cumulative) = 92.9, Sampling (Cumulative) = 75.8
* Checkpoint 7: Iterative (Pass@1) = 94.1, Iterative (Cumulative) = 93.5, Sampling (Cumulative) = 76.2
**Bottom Chart:**
* **SFT Baseline:** Remains constant at approximately 60.6 across all values of k.
* **Sampling Only (SC@k):** Starts at 61.9 at k=10, increases to 70.0 at k=20, then rises to 74.1 at k=60.
**Specific Data Points (Bottom Chart):**
* k=10: Sampling (SC@k) = 61.9
* k=20: Sampling (SC@k) = 72.2
* k=30: Sampling (SC@k) = 73.4
* k=40: Sampling (SC@k) = 73.4
* k=50: Sampling (SC@k) = 74.1
* k=60: Sampling (SC@k) = 74.1
### Key Observations
* Both Iterative Learning strategies significantly outperform the SFT Baseline in the top chart, demonstrating the effectiveness of iterative approaches in improving pass rate.
* The "Iterative Learning (Pass@1)" strategy consistently achieves the highest pass rates.
* The "Sampling Only (Cumulative)" strategy shows a gradual improvement in pass rate with increasing checkpoints, but remains below the Iterative Learning strategies.
* In the bottom chart, the "Sampling Only (SC@k)" strategy shows a moderate improvement in accuracy as k increases, but the gains are relatively small.
* The SFT Baseline remains consistently low in both charts, indicating its limited performance compared to the other strategies.
### Interpretation
The data suggests that iterative learning strategies are highly effective in improving model performance on the ARC-C task, as evidenced by the substantial increase in pass rate compared to the SFT Baseline. The "Pass@1" metric appears to be particularly sensitive to iterative learning, achieving the highest performance. The bottom chart indicates that simply increasing the sampling size (k) provides limited gains in accuracy, suggesting that the sampling strategy alone is not as effective as iterative learning.
The consistent performance of the SFT Baseline suggests that it represents a lower bound on achievable performance. The differences between the iterative learning strategies and the sampling-only strategy highlight the importance of incorporating feedback and refinement into the learning process. The relatively flat accuracy curve for the sampling-only strategy suggests diminishing returns as k increases, indicating that there may be other factors limiting performance.
The ARC-C dataset appears to be a challenging benchmark, as even the best-performing strategies do not achieve 100% pass rate. Further investigation could explore the reasons for the remaining performance gap and identify potential areas for improvement.