## Bar Charts: Performance Comparison of Methods
### Overview
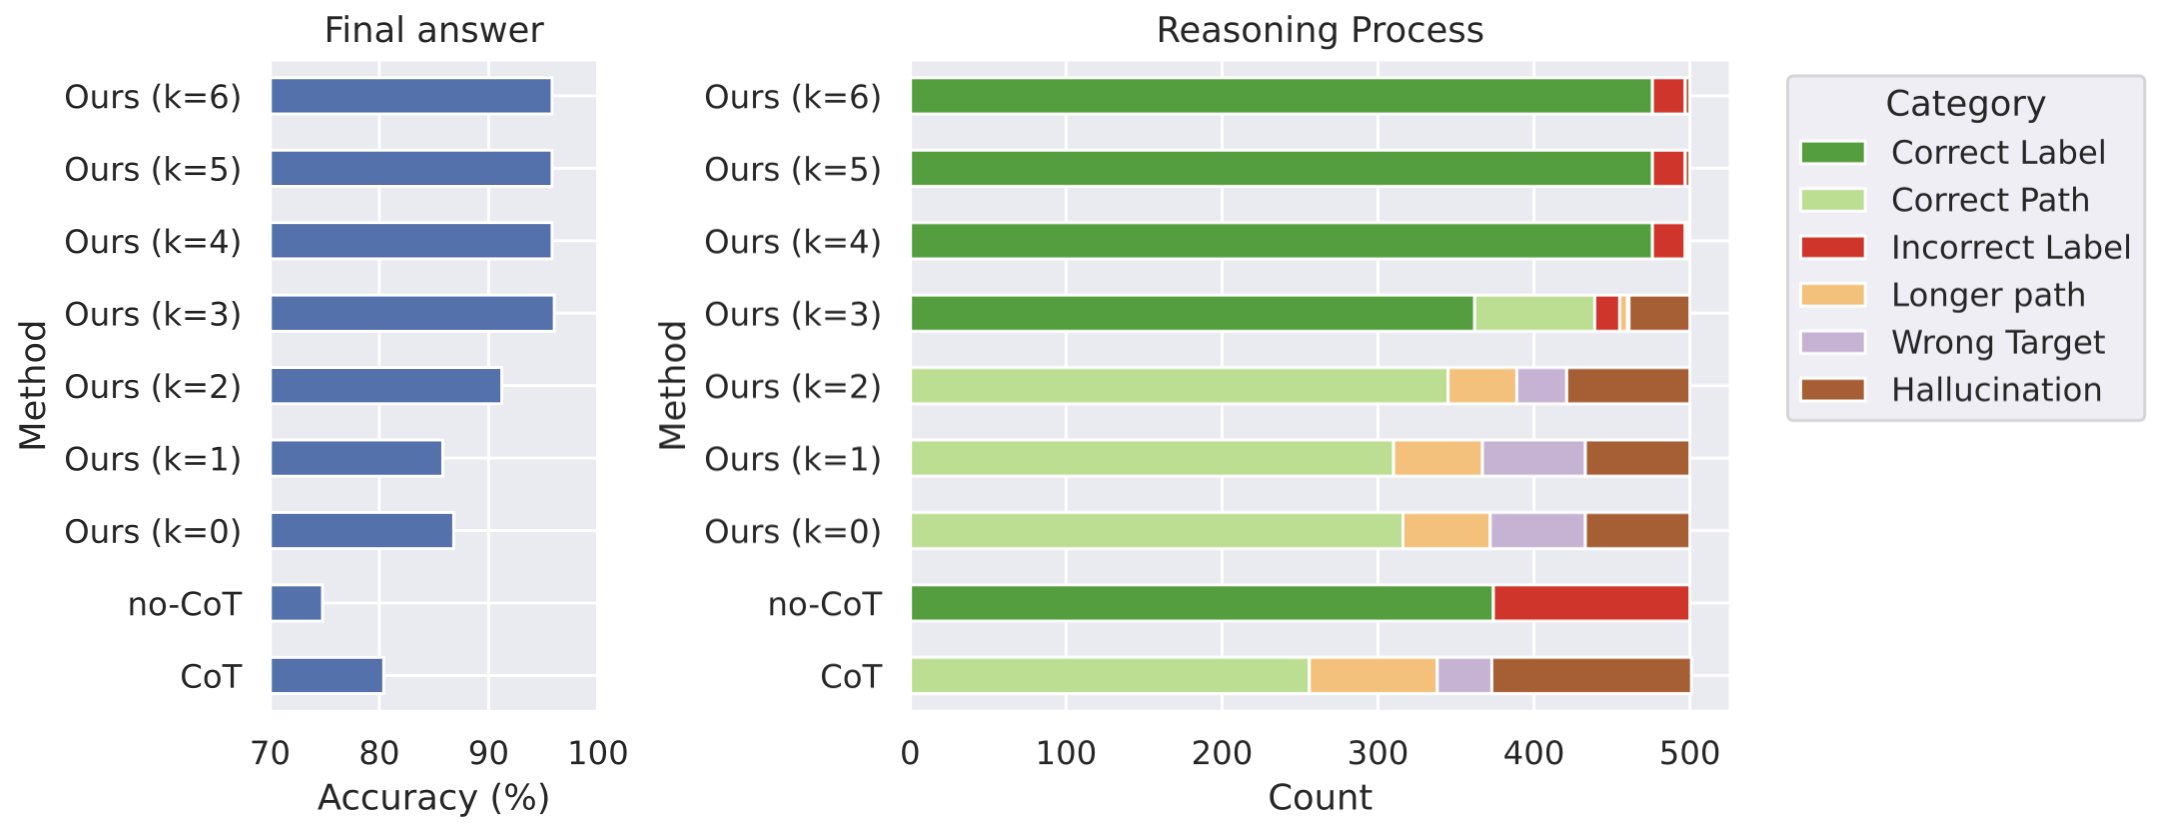
The image presents two horizontal bar charts side-by-side. The left chart displays "Accuracy (%)" for different methods, while the right chart shows the "Count" of occurrences for various categories within those methods. The methods being compared are variations of "Ours (k=x)" where x ranges from 0 to 6, "no-CoT", and "CoT". The right chart's legend categorizes reasoning outcomes as "Correct Label", "Correct Path", "Incorrect Label", "Longer path", "Wrong Target", and "Hallucination".
### Components/Axes
* **Left Chart:**
* Y-axis: Method (Ours (k=6), Ours (k=5), Ours (k=4), Ours (k=3), Ours (k=2), Ours (k=1), Ours (k=0), no-CoT, CoT)
* X-axis: Accuracy (%) - Scale ranges from 70 to 100, with increments of 10.
* **Right Chart:**
* Y-axis: Method (Ours (k=6), Ours (k=5), Ours (k=4), Ours (k=3), Ours (k=2), Ours (k=1), Ours (k=0), no-CoT, CoT)
* X-axis: Count - Scale ranges from 0 to 500, with increments of 100.
* **Legend (Top-Right):**
* Green: Correct Label
* Light Green: Correct Path
* Red: Incorrect Label
* Orange: Longer path
* Purple: Wrong Target
* Pink: Hallucination
### Detailed Analysis or Content Details
**Left Chart - Accuracy (%)**
* **Ours (k=6):** Approximately 98% accuracy.
* **Ours (k=5):** Approximately 96% accuracy.
* **Ours (k=4):** Approximately 94% accuracy.
* **Ours (k=3):** Approximately 88% accuracy.
* **Ours (k=2):** Approximately 84% accuracy.
* **Ours (k=1):** Approximately 82% accuracy.
* **Ours (k=0):** Approximately 80% accuracy.
* **no-CoT:** Approximately 75% accuracy.
* **CoT:** Approximately 78% accuracy.
The "Ours (k=x)" methods show a clear trend: accuracy decreases as 'k' decreases.
**Right Chart - Count**
* **Ours (k=6):** Predominantly Correct Label (green, ~450 count), with a smaller portion of Correct Path (light green, ~50 count). Minimal presence of other categories.
* **Ours (k=5):** Dominantly Correct Label (green, ~400 count), with a significant Correct Path (light green, ~100 count). Small amounts of Incorrect Label (red, ~25 count) and Longer Path (orange, ~25 count).
* **Ours (k=4):** Correct Label (green, ~300 count), Correct Path (light green, ~100 count), Incorrect Label (red, ~75 count), Longer Path (orange, ~50 count), and a small amount of Wrong Target (purple, ~25 count).
* **Ours (k=3):** Correct Label (green, ~200 count), Correct Path (light green, ~100 count), Incorrect Label (red, ~100 count), Longer Path (orange, ~50 count), Wrong Target (purple, ~50 count), and Hallucination (pink, ~25 count).
* **Ours (k=2):** Correct Label (green, ~150 count), Correct Path (light green, ~75 count), Incorrect Label (red, ~100 count), Longer Path (orange, ~75 count), Wrong Target (purple, ~75 count), and Hallucination (pink, ~25 count).
* **Ours (k=1):** Correct Label (green, ~100 count), Correct Path (light green, ~50 count), Incorrect Label (red, ~100 count), Longer Path (orange, ~100 count), Wrong Target (purple, ~100 count), and Hallucination (pink, ~50 count).
* **Ours (k=0):** Correct Label (green, ~100 count), Correct Path (light green, ~50 count), Incorrect Label (red, ~100 count), Longer Path (orange, ~100 count), Wrong Target (purple, ~100 count), and Hallucination (pink, ~50 count).
* **no-CoT:** Predominantly Incorrect Label (red, ~300 count), with a significant amount of Wrong Target (purple, ~100 count) and Hallucination (pink, ~50 count).
* **CoT:** Incorrect Label (red, ~250 count), Wrong Target (purple, ~150 count), and Hallucination (pink, ~100 count).
As 'k' decreases in the "Ours" methods, the proportion of errors (Incorrect Label, Longer Path, Wrong Target, Hallucination) increases.
### Key Observations
* The "Ours" methods with higher 'k' values (k=6, k=5, k=4) demonstrate significantly higher accuracy compared to the other methods.
* The "no-CoT" and "CoT" methods have substantially lower accuracy.
* The error categories (Incorrect Label, Longer Path, Wrong Target, Hallucination) become more prominent as 'k' decreases in the "Ours" methods.
* The "no-CoT" method is heavily dominated by "Incorrect Label" and "Wrong Target" errors.
### Interpretation
The data suggests that the proposed "Ours" method, particularly with larger 'k' values, significantly improves accuracy in the task being evaluated. The parameter 'k' appears to control the robustness of the reasoning process; higher values of 'k' lead to more correct labels and paths, while lower values introduce more errors. The "no-CoT" and "CoT" methods, while providing a baseline, are considerably less effective.
The right chart provides insight into *why* the methods perform differently. The "Ours" methods with high 'k' values primarily succeed in identifying the correct label, indicating a strong ability to arrive at the correct answer. As 'k' decreases, the reasoning process becomes more prone to errors, resulting in incorrect labels, longer paths (potentially indicating inefficient reasoning), wrong targets, and even hallucinations (generating outputs unrelated to the input).
The observed trends suggest that the "Ours" method leverages a mechanism (potentially related to the 'k' parameter) to enhance the reliability and accuracy of its reasoning process. The data highlights the importance of robust reasoning in achieving high performance on this task. The increase in error categories as 'k' decreases indicates a trade-off between computational cost (potentially related to 'k') and accuracy.