\n
## Horizontal Bar Charts: Method Performance Analysis
### Overview
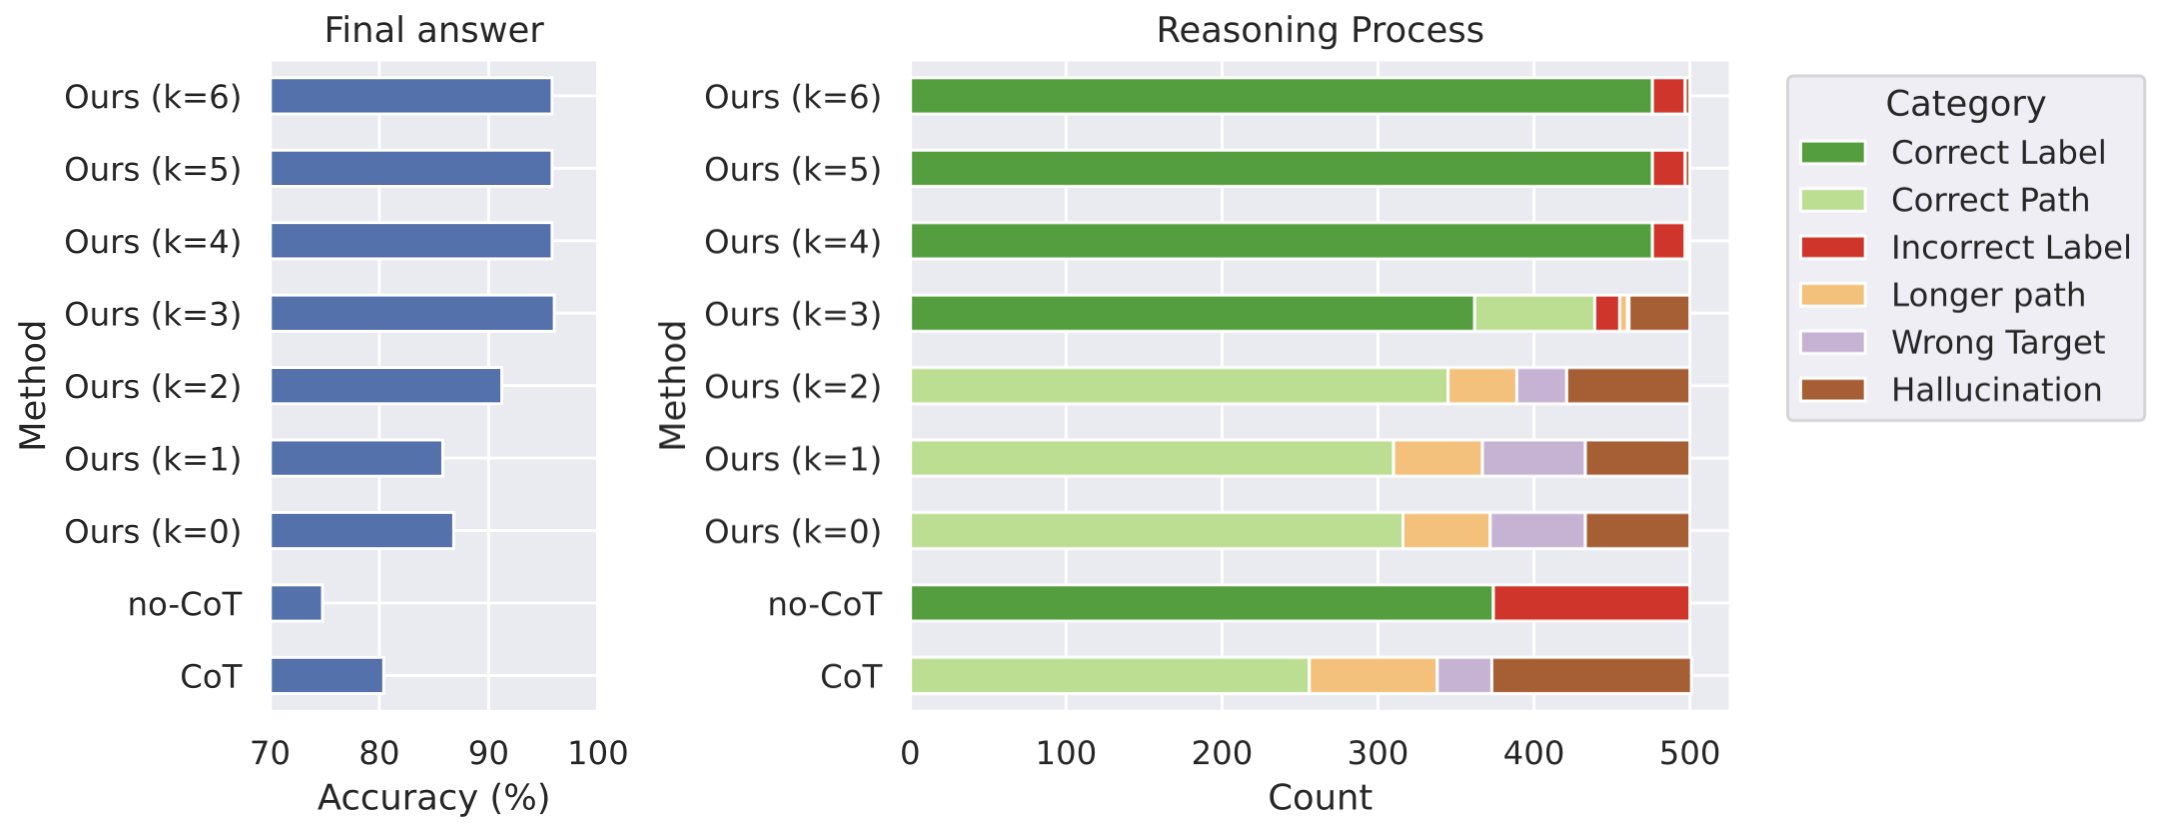
The image displays two horizontal bar charts comparing the performance of different reasoning methods. The left chart, titled "Final answer," shows the accuracy percentage for each method. The right chart, titled "Reasoning Process," provides a stacked bar breakdown of the reasoning outcomes for the same methods, categorized by type of error or success. A legend on the right defines the color-coded categories for the stacked bars.
### Components/Axes
**Left Chart ("Final answer"):**
* **Y-axis (Vertical):** Labeled "Method". Categories listed from top to bottom: "Ours (k=6)", "Ours (k=5)", "Ours (k=4)", "Ours (k=3)", "Ours (k=2)", "Ours (k=1)", "Ours (k=0)", "no-CoT", "CoT".
* **X-axis (Horizontal):** Labeled "Accuracy (%)". Scale ranges from 70 to 100, with major tick marks at 70, 80, 90, 100.
**Right Chart ("Reasoning Process"):**
* **Y-axis (Vertical):** Labeled "Method". Identical categories as the left chart, in the same order.
* **X-axis (Horizontal):** Labeled "Count". Scale ranges from 0 to 500, with major tick marks at 0, 100, 200, 300, 400, 500.
* **Legend (Top-Right):** Titled "Category". Contains six color-coded entries:
* Dark Green: "Correct Label"
* Light Green: "Correct Path"
* Red: "Incorrect Label"
* Orange: "Longer path"
* Purple: "Wrong Target"
* Brown: "Hallucination"
### Detailed Analysis
**Left Chart - Final Answer Accuracy:**
* **Trend:** Accuracy generally increases as the parameter 'k' increases from 0 to 6 for the "Ours" method. The "no-CoT" method has the lowest accuracy, while "CoT" performs better than "no-CoT" but worse than most "Ours" variants.
* **Approximate Data Points (Accuracy %):**
* Ours (k=6): ~96%
* Ours (k=5): ~96%
* Ours (k=4): ~96%
* Ours (k=3): ~96%
* Ours (k=2): ~91%
* Ours (k=1): ~86%
* Ours (k=0): ~87%
* no-CoT: ~74%
* CoT: ~80%
**Right Chart - Reasoning Process Breakdown (Stacked Bars, Total Count ~500 per method):**
* **Ours (k=6):** Dominated by a large "Correct Label" (dark green) segment (~480 count), with a very small "Incorrect Label" (red) segment (~20 count).
* **Ours (k=5):** Similar to k=6: large "Correct Label" (~480), small "Incorrect Label" (~20).
* **Ours (k=4):** Similar to k=6 and k=5: large "Correct Label" (~480), small "Incorrect Label" (~20).
* **Ours (k=3):** Mix of categories. "Correct Label" (dark green, ~360), "Correct Path" (light green, ~80), "Incorrect Label" (red, ~20), "Hallucination" (brown, ~40).
* **Ours (k=2):** "Correct Path" (light green, ~340), "Longer path" (orange, ~60), "Wrong Target" (purple, ~40), "Hallucination" (brown, ~60).
* **Ours (k=1):** "Correct Path" (light green, ~310), "Longer path" (orange, ~60), "Wrong Target" (purple, ~60), "Hallucination" (brown, ~70).
* **Ours (k=0):** "Correct Path" (light green, ~320), "Longer path" (orange, ~50), "Wrong Target" (purple, ~60), "Hallucination" (brown, ~70).
* **no-CoT:** "Correct Label" (dark green, ~370), "Incorrect Label" (red, ~130).
* **CoT:** "Correct Path" (light green, ~250), "Longer path" (orange, ~80), "Wrong Target" (purple, ~40), "Hallucination" (brown, ~130).
### Key Observations
1. **Performance Plateau:** The "Ours" method's final answer accuracy plateaus at approximately 96% for k=3, 4, 5, and 6.
2. **Reasoning Quality Shift:** There is a clear shift in reasoning quality as 'k' increases. For k=0,1,2, the reasoning is primarily "Correct Path" (light green) but with significant error categories (Longer path, Wrong Target, Hallucination). For k=4,5,6, the reasoning is overwhelmingly "Correct Label" (dark green) with minimal errors.
3. **"no-CoT" Anomaly:** The "no-CoT" method has very low final answer accuracy (~74%), yet its reasoning process shows a high proportion of "Correct Label" (~74% of its bar). This suggests it often identifies the correct label but fails to produce a correct final answer, possibly due to a lack of structured reasoning.
4. **"CoT" vs. "Ours (k=0)":** The standard Chain-of-Thought ("CoT") method has lower accuracy (~80%) than "Ours (k=0)" (~87%). Its reasoning breakdown shows a larger "Hallucination" segment compared to "Ours (k=0)".
### Interpretation
The data demonstrates the effectiveness of the proposed method ("Ours") with increasing values of the parameter 'k'. The charts tell a two-part story:
1. **Outcome vs. Process:** The left chart shows the final outcome (accuracy), while the right chart reveals the quality of the underlying reasoning process. High final accuracy (k=4,5,6) is strongly correlated with a reasoning process that predominantly yields the "Correct Label" directly, minimizing errors like hallucinations or wrong targets.
2. **The Role of 'k':** The parameter 'k' appears to control the depth or quality of the reasoning process. At low 'k' (0,1,2), the model finds a correct reasoning path ("Correct Path") but is prone to execution errors (Longer path, Wrong Target, Hallucination), leading to lower final accuracy. At high 'k' (4,5,6), the model consistently identifies the correct label through its reasoning, resulting in high and stable final accuracy. The plateau suggests diminishing returns beyond k=4.
3. **Diagnostic Value of the Breakdown:** The "Reasoning Process" chart is crucial for diagnosis. For instance, the "no-CoT" method's high "Correct Label" count but low accuracy indicates a disconnect between its internal labeling and its final answer generation. The "CoT" method's significant "Hallucination" segment points to a specific weakness in its reasoning chain that the "Ours" method (especially with higher k) appears to mitigate.
In essence, the visualization argues that the "Ours" method, when configured with a sufficient 'k' (≥4), not only achieves high accuracy but does so via a robust and reliable reasoning process that avoids common failure modes like hallucinations and incorrect targets.