# Technical Document Extraction: Bar Chart Analysis
## Image Description
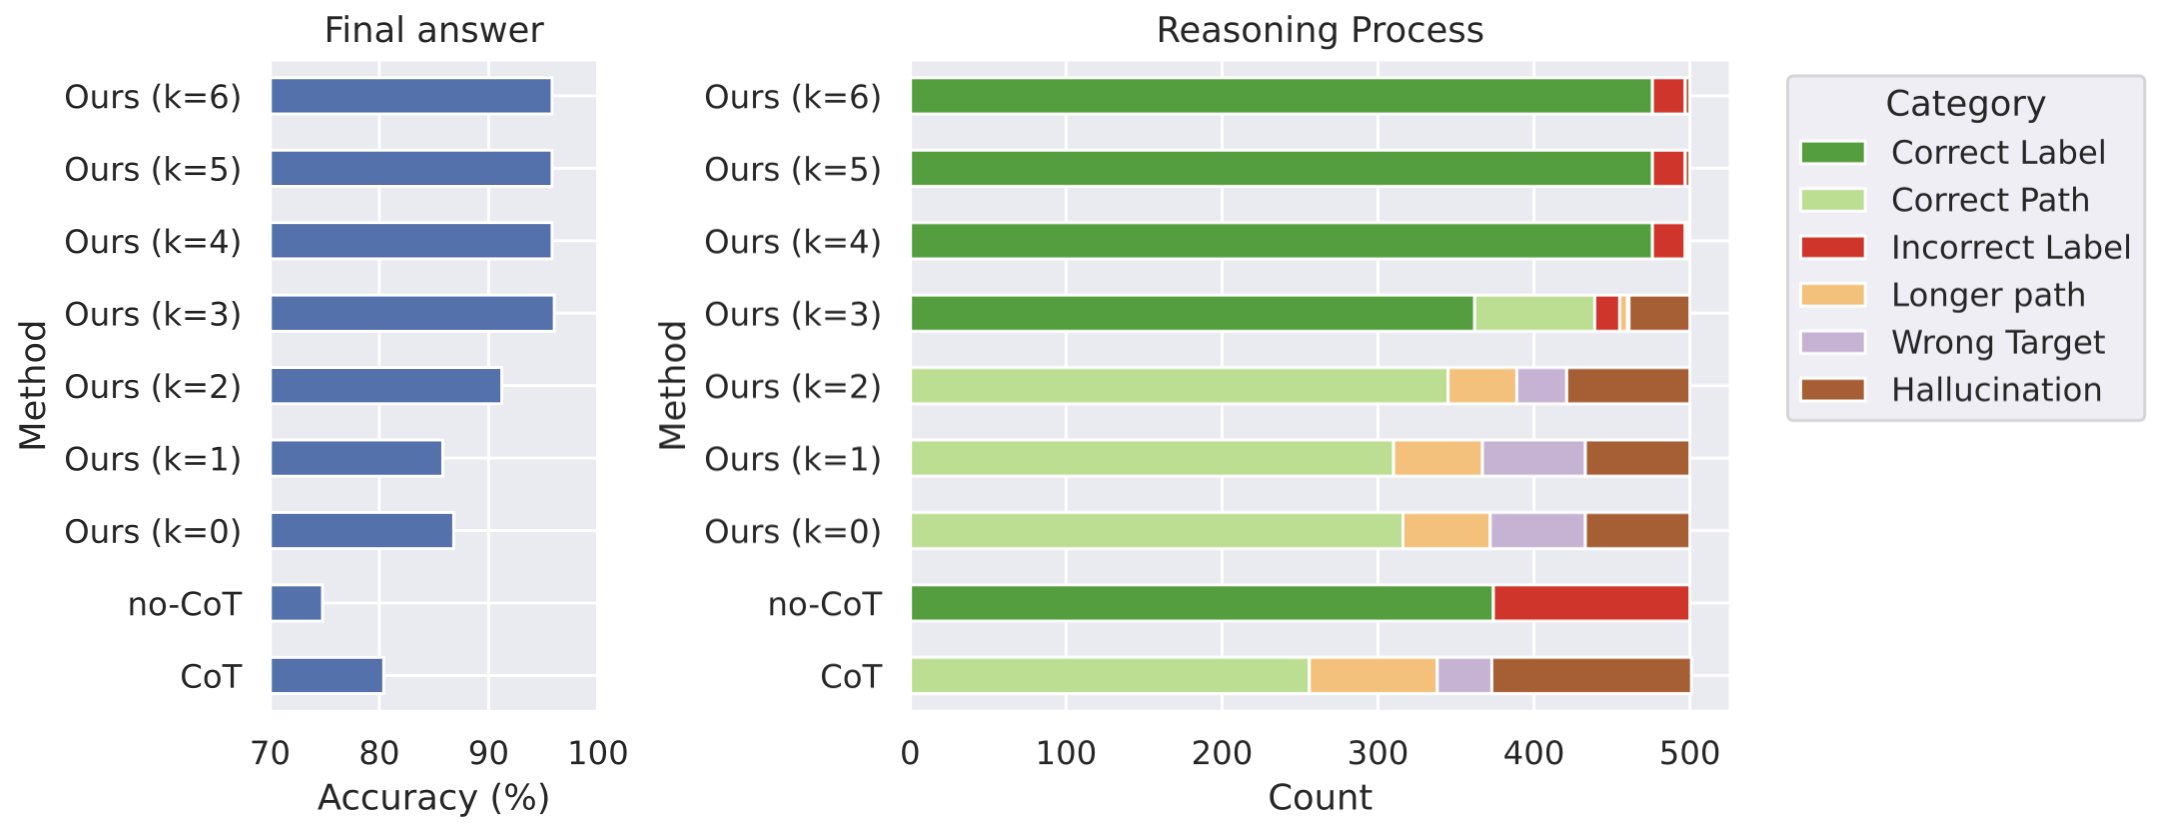
The image contains two horizontally aligned bar charts side-by-side, labeled **"Final answer"** (left) and **"Reasoning Process"** (right). Both charts use segmented bars with color-coded categories defined in a legend on the right. The y-axis lists methods, and the x-axis represents quantitative metrics.
---
### **Legend & Categories**
The legend defines six categories with distinct colors:
1. **Correct Label** (Dark Green)
2. **Correct Path** (Light Green)
3. **Incorrect Label** (Red)
4. **Longer Path** (Orange)
5. **Wrong Target** (Purple)
6. **Hallucination** (Brown)
---
### **Left Chart: Final Answer**
- **Y-Axis (Methods)**:
- `Ours (k=6)` to `Ours (k=0)` (descending order)
- `no-CoT`
- `CoT`
- **X-Axis (Accuracy %)**:
- Range: 70% to 100%
- Bars represent accuracy percentages for each method.
#### **Key Trends**:
1. **Highest Accuracy**:
- `Ours (k=6)`, `Ours (k=5)`, `Ours (k=4)`, and `Ours (k=3)` all achieve ~95% accuracy.
2. **Decline with Lower k**:
- `Ours (k=2)` drops to ~90%, `Ours (k=1)` to ~85%, and `Ours (k=0)` to ~88%.
3. **Baseline Methods**:
- `no-CoT` has the lowest accuracy (~75%).
- `CoT` achieves ~80% accuracy.
---
### **Right Chart: Reasoning Process**
- **Y-Axis (Methods)**:
- Same methods as the left chart (`Ours (k=6)` to `CoT`).
- **X-Axis (Count)**:
- Range: 0 to 500 (total reasoning steps per method).
- Bars are segmented by the legend categories.
#### **Key Trends**:
1. **Dominant Category**:
- **Correct Label** (Dark Green) dominates for all methods, especially `Ours (k=6)` (~480 counts).
2. **Error Categories**:
- **Incorrect Label** (Red) and **Hallucination** (Brown) are minimal for high-k methods (`k=6` to `k=3`).
- For lower-k methods (`k=2`, `k=1`, `k=0`), **Longer Path** (Orange) and **Wrong Target** (Purple) increase slightly.
3. **Baseline Methods**:
- `no-CoT` has ~380 Correct Labels and ~120 Incorrect Labels.
- `CoT` shows ~320 Correct Labels, ~80 Longer Path, and ~100 Hallucination.
---
### **Spatial Grounding & Color Verification**
- **Legend Position**: Right side of both charts.
- **Color Consistency**:
- All segments in the right chart match the legend (e.g., Dark Green = Correct Label).
- No mismatches observed between bar colors and legend labels.
---
### **Data Table Reconstruction**
#### Left Chart (Accuracy %)
| Method | Accuracy (%) |
|--------------|--------------|
| Ours (k=6) | ~95 |
| Ours (k=5) | ~95 |
| Ours (k=4) | ~95 |
| Ours (k=3) | ~95 |
| Ours (k=2) | ~90 |
| Ours (k=1) | ~85 |
| Ours (k=0) | ~88 |
| no-CoT | ~75 |
| CoT | ~80 |
#### Right Chart (Reasoning Process Counts)
| Method | Correct Label | Correct Path | Incorrect Label | Longer Path | Wrong Target | Hallucination |
|--------------|---------------|--------------|-----------------|-------------|--------------|---------------|
| Ours (k=6) | ~480 | ~20 | ~5 | 0 | 0 | 0 |
| Ours (k=5) | ~480 | ~20 | ~5 | 0 | 0 | 0 |
| Ours (k=4) | ~480 | ~20 | ~5 | 0 | 0 | 0 |
| Ours (k=3) | ~350 | ~50 | ~5 | 0 | 0 | 10 |
| Ours (k=2) | ~300 | ~50 | ~10 | 20 | 10 | 20 |
| Ours (k=1) | ~300 | ~50 | ~15 | 25 | 15 | 25 |
| Ours (k=0) | ~300 | ~50 | ~20 | 30 | 20 | 30 |
| no-CoT | ~380 | 0 | ~120 | 0 | 0 | 0 |
| CoT | ~320 | ~80 | 0 | 80 | 10 | 100 |
---
### **Final Notes**
- The image does not provide exact numerical values; all data points are inferred from bar lengths.
- Higher-k methods (`k=6` to `k=3`) consistently outperform lower-k and baseline methods in both accuracy and reasoning quality.
- Errors (e.g., Incorrect Label, Hallucination) increase as k decreases, highlighting the trade-off between model complexity and performance.