\n
## Diagram: Program Development and Refinement Process
### Overview
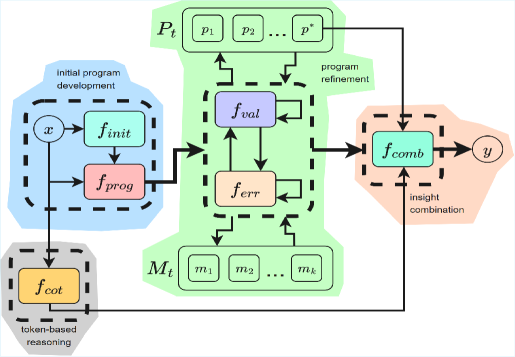
The image depicts a diagram illustrating a program development and refinement process. It shows a flow of information between several components, representing initial program development, program refinement, and insight combination. The diagram is segmented into four main areas, each with a distinct color and function.
### Components/Axes
The diagram consists of the following components:
* **Initial Program Development (Blue Area):** Contains `x` (input), `f_init` (initial function), and `f_prog` (program function).
* **Program Refinement (Green Area):** Contains `P_t` (a set of programs p1 to pr), `f_val` (validation function), `f_err` (error function), and `M_t` (a set of models m1 to mk).
* **Insight Combination (Orange Area):** Contains `f_comb` (combination function) and `y` (output).
* **Token-Based Reasoning (Yellow Area):** Contains `f_tot` (total function).
The diagram also includes labels indicating the flow of information: "program refinement" and "insight combination".
### Detailed Analysis or Content Details
The diagram illustrates the following flow:
1. An input `x` enters the "Initial Program Development" area.
2. `x` is processed by `f_init` and `f_prog`.
3. The output of `f_prog` is fed into the "Program Refinement" area.
4. Within the "Program Refinement" area, the output is processed by `f_val` and `f_err`.
5. `f_val` and `f_err` are connected to `P_t` (p1 to pr) and `M_t` (m1 to mk) with dashed arrows, indicating feedback loops.
6. The outputs of `f_val` and `f_err` are fed into `f_comb` in the "Insight Combination" area.
7. `f_comb` produces an output `y`.
8. The output `y` is fed back into the "Program Refinement" area, creating a refinement loop.
9. The output of `f_prog` is also fed into `f_tot` in the "Token-Based Reasoning" area.
10. The output of `f_tot` is fed into the "Program Refinement" area, specifically to `M_t`.
The diagram uses arrows to indicate the direction of information flow. The dashed arrows suggest iterative refinement or feedback loops. The components are represented as rectangular boxes with labels inside.
### Key Observations
The diagram highlights an iterative process of program development and refinement. The feedback loops suggest that the program is continuously improved based on validation and error analysis. The inclusion of "token-based reasoning" indicates that the process leverages token-based methods for analysis and refinement. The diagram does not contain any numerical data or specific values.
### Interpretation
The diagram represents a conceptual model of an intelligent program development system. The initial program development phase generates a basic program (`f_prog`). The program refinement phase uses validation (`f_val`) and error analysis (`f_err`) to improve the program based on a set of programs (`P_t`) and models (`M_t`). The insight combination phase integrates the refined program to produce a final output (`y`). The token-based reasoning component (`f_tot`) provides additional insights for refinement.
The diagram suggests a closed-loop system where the program is continuously refined based on feedback and analysis. The use of token-based reasoning indicates a focus on understanding the program's behavior at a granular level. The diagram is a high-level representation and does not provide details on the specific algorithms or techniques used in each component. It is a conceptual illustration of a complex process, likely related to automated program synthesis or debugging. The diagram is a visual representation of a system that learns and improves through iterative refinement. The iterative nature of the process is emphasized by the feedback loops. The diagram does not provide any quantitative data, but it clearly illustrates the relationships between the different components of the system.