## [System Diagram]: Program Refinement and Insight Combination Flowchart
### Overview
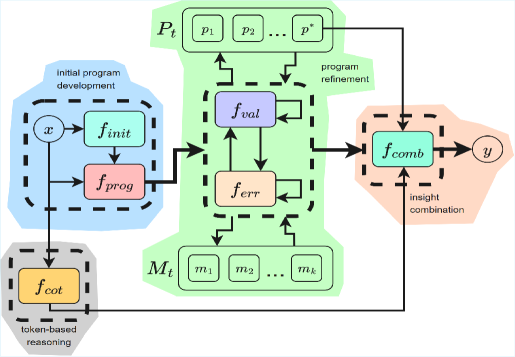
The image is a technical flowchart illustrating a multi-stage process for program development, refinement, and insight combination. It depicts a system that takes an initial input `x`, develops and refines a program through iterative validation and error correction, and combines insights to produce a final output `y`. The diagram uses color-coded regions to group related functional components and arrows to indicate data flow and control dependencies.
### Components/Axes
The diagram is organized into four primary, color-coded functional regions:
1. **Blue Region (Left): "initial program development"**
* Contains a dashed box enclosing two functions.
* **Input:** `x` (a circle node).
* **Functions:**
* `f_init` (green rectangle).
* `f_prog` (red rectangle).
* **Flow:** `x` feeds into both `f_init` and `f_prog`. The output of `f_prog` flows to the central green region.
2. **Gray Region (Bottom-Left): "token-based reasoning"**
* Contains a single function: `f_cot` (yellow rectangle).
* **Flow:** Receives input from `x` (via a downward arrow). Its output flows to the orange region on the right.
3. **Green Region (Center): "program refinement"**
* This is the largest region, indicating an iterative core process.
* **Top Sub-block (`P_t`):** A rounded rectangle labeled `P_t` containing a sequence: `p₁`, `p₂`, ..., `p*`. This likely represents a set of program candidates or parameters at step `t`.
* **Bottom Sub-block (`M_t`):** A rounded rectangle labeled `M_t` containing a sequence: `m₁`, `m₂`, ..., `mₖ`. This likely represents a set of models, metrics, or memory items at step `t`.
* **Central Functions (within a dashed box):**
* `f_val` (purple rectangle): Validation function.
* `f_err` (pink rectangle): Error function.
* **Flow:** The output from `f_prog` (blue region) enters this region. There are complex, bidirectional feedback loops:
* `P_t` and `M_t` both feed into `f_val` and `f_err`.
* `f_val` and `f_err` have outputs that loop back to update `P_t` and `M_t`.
* The refined output from this region flows to the orange region.
4. **Orange Region (Right): "insight combination"**
* Contains a single function: `f_comb` (cyan rectangle).
* **Inputs:** Receives data from two sources:
1. The main flow from the green "program refinement" region.
2. The output from `f_cot` in the gray "token-based reasoning" region.
* **Output:** Produces the final result `y` (a circle node).
### Detailed Analysis
The diagram describes a closed-loop, iterative system for program synthesis or improvement.
* **Initial Phase:** The process begins with input `x`. The `f_init` function likely creates an initial program state, while `f_prog` generates the first program version. Concurrently, `f_cot` performs a separate "chain-of-thought" reasoning process on the same input `x`.
* **Refinement Loop:** The core is the green region. The program candidate set `P_t` and the model/metric set `M_t` are evaluated by `f_val` (validation) and `f_err` (error calculation). The results of this evaluation are used to update `P_t` and `M_t`, creating an iterative refinement cycle. The arrows suggest that both the program parameters and the evaluation models are updated based on validation and error signals.
* **Final Combination:** The refined program output and the independent reasoning trace from `f_cot` are merged by the `f_comb` function. This suggests the system combines structured program refinement with a separate reasoning pathway to produce the final output `y`.
### Key Observations
1. **Iterative Core:** The central green region is the most complex, with multiple feedback loops, highlighting that program refinement is an iterative, not a one-pass, process.
2. **Parallel Processing:** The system runs two parallel paths from the start: the main program development path (blue -> green) and a separate token-based reasoning path (gray). These paths converge only at the final combination stage.
3. **Dual Update Mechanism:** Within the refinement loop, both the program set (`P_t`) and the model/metric set (`M_t`) are updated, indicating the system may be co-adapting the solution and its evaluation criteria.
4. **Clear Functional Separation:** Each colored region has a distinct, labeled purpose, making the high-level architecture easy to follow despite the internal complexity of the refinement loop.
### Interpretation
This diagram represents a sophisticated **iterative program synthesis or repair system**. The key insight is that effective program generation isn't a single step but a cycle of proposal (`f_prog`), evaluation (`f_val`, `f_err`), and update (`P_t`, `M_t`). The inclusion of a separate "token-based reasoning" (`f_cot`) pathway suggests the system leverages both formal program manipulation and a more flexible, perhaps language-model-based, reasoning process. The final `f_comb` function acts as a fusion layer, integrating the strengths of both approaches. This architecture is typical of modern AI systems that combine symbolic program search with neural network-based reasoning and evaluation to solve complex tasks. The "uncertainty" in this context is not numerical but architectural; the exact algorithms for `f_val`, `f_err`, and the update rules for `P_t`/`M_t` are abstracted away, representing the core research challenges of such a system.