## Diagram: Gemini Pre-training and Data Flywheel
### Overview
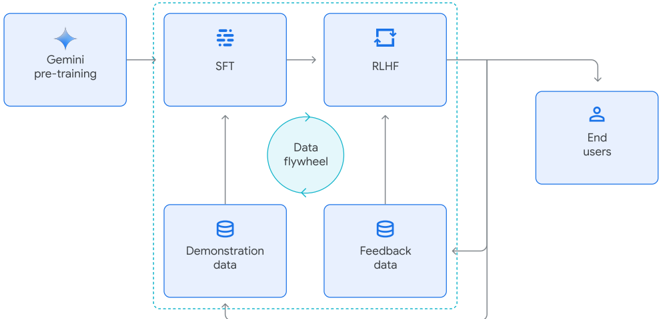
The image is a diagram illustrating the process of Gemini pre-training and a data flywheel. It shows the flow of data and processes involved in training and refining a model, incorporating feedback from end-users.
### Components/Axes
* **Nodes:** The diagram contains rectangular nodes representing different stages or components. These nodes are light blue with rounded corners.
* **Arrows:** Arrows indicate the flow of data or processes between the nodes.
* **Data Flywheel:** A circular arrow represents a continuous feedback loop.
* **Text Labels:** Each node is labeled with text describing its function or content.
### Detailed Analysis
1. **Gemini pre-training:** Located at the top-left of the diagram. It is represented by a light blue rounded rectangle with a diamond icon.
2. **SFT:** Located to the right of "Gemini pre-training". It is represented by a light blue rounded rectangle with a grid icon. An arrow connects "Gemini pre-training" to "SFT".
3. **RLHF:** Located to the right of "SFT". It is represented by a light blue rounded rectangle with a circular arrow icon. An arrow connects "SFT" to "RLHF".
4. **End users:** Located to the right of "RLHF". It is represented by a light blue rounded rectangle with a person icon. An arrow connects "RLHF" to "End users".
5. **Demonstration data:** Located at the bottom-left of the diagram. It is represented by a light blue rounded rectangle with a database icon. An arrow connects "Demonstration data" to "SFT".
6. **Feedback data:** Located to the right of "Demonstration data". It is represented by a light blue rounded rectangle with a database icon. An arrow connects "Feedback data" to "RLHF". An arrow also connects "Feedback data" to "End users".
7. **Data flywheel:** Located in the center of the diagram. It is represented by a circular arrow connecting "Demonstration data" and "Feedback data".
8. A dashed light blue rounded rectangle surrounds the "SFT", "RLHF", "Demonstration data", "Feedback data", and "Data flywheel" components.
### Key Observations
* The diagram illustrates a sequential process starting with Gemini pre-training, followed by SFT and RLHF.
* The data flywheel represents a continuous feedback loop between demonstration data and feedback data.
* End users provide feedback that influences the model.
### Interpretation
The diagram depicts a machine learning training pipeline. Gemini pre-training likely refers to an initial training phase. SFT (Supervised Fine-Tuning) and RLHF (Reinforcement Learning from Human Feedback) are subsequent stages that refine the model based on data and human input. The data flywheel emphasizes the iterative nature of the training process, where demonstration data and user feedback are continuously used to improve the model. The connection from RLHF and Feedback data to End Users suggests that the model's output and user feedback are both considered in the final product.