\n
## Diagram: Gemini Model Training and Feedback Loop
### Overview
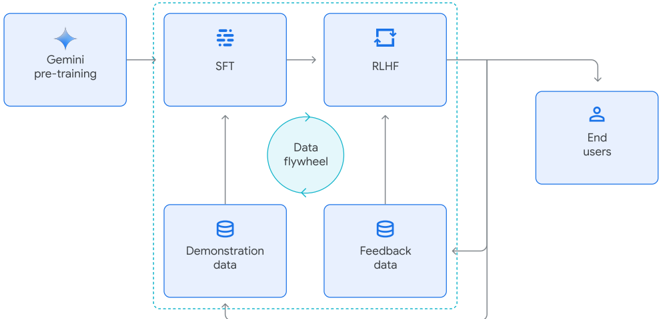
The image depicts a diagram illustrating the training and feedback loop for the Gemini model. It shows a cyclical process involving pre-training, supervised fine-tuning (SFT), reinforcement learning from human feedback (RLHF), and data collection from end-users. The diagram emphasizes the iterative nature of model improvement through data feedback.
### Components/Axes
The diagram consists of the following components:
* **Gemini pre-training:** A light blue rounded rectangle labeled "Gemini pre-training" positioned on the left side of the diagram.
* **SFT:** A light blue rounded rectangle labeled "SFT" (Supervised Fine-Tuning) positioned in the upper-center of the diagram.
* **RLHF:** A light blue rounded rectangle labeled "RLHF" (Reinforcement Learning from Human Feedback) positioned to the right of "SFT".
* **Data flywheel:** A light blue circle labeled "Data flywheel" positioned in the center of the diagram.
* **Demonstration data:** A light blue rounded rectangle labeled "Demonstration data" positioned at the bottom-left of the diagram.
* **Feedback data:** A light blue rounded rectangle labeled "Feedback data" positioned at the bottom-right of the diagram.
* **End users:** A light blue rounded rectangle labeled "End users" positioned on the right side of the diagram.
Arrows indicate the flow of data and the relationships between these components. A dashed line encloses the SFT, RLHF, Data flywheel, Demonstration data, and Feedback data components, suggesting they form a core iterative loop.
### Detailed Analysis or Content Details
The diagram illustrates a process flow as follows:
1. **Gemini pre-training** feeds into **SFT**.
2. **SFT** feeds into **RLHF**.
3. **RLHF** feeds into **End users**.
4. **End users** provide **Feedback data**.
5. **Feedback data** feeds into the **Data flywheel**.
6. **Demonstration data** also feeds into the **Data flywheel**.
7. The **Data flywheel** then feeds back into both **SFT** and **Demonstration data**.
The arrows indicate a continuous loop where user feedback and demonstration data are used to refine the model through SFT and RLHF. The "Data flywheel" represents the accumulation and utilization of data for ongoing improvement.
### Key Observations
The diagram highlights the importance of a feedback loop in model development. The cyclical nature of the process suggests that the model is continuously learning and improving based on real-world usage and human input. The inclusion of both "Demonstration data" and "Feedback data" indicates a multi-faceted approach to data collection.
### Interpretation
This diagram illustrates a modern machine learning development paradigm, particularly common in large language models. The "Gemini pre-training" stage represents the initial training on a massive dataset. The subsequent SFT and RLHF stages refine the model's behavior to align with human preferences and instructions. The "Data flywheel" is a crucial element, representing the continuous collection and utilization of data generated by users. This data is then used to further improve the model, creating a positive feedback loop. The diagram suggests that the Gemini model is designed to be iteratively improved through real-world interaction and feedback, rather than being a static entity. The dashed line around the core loop emphasizes the self-improving nature of the system. The diagram does not contain any numerical data or specific metrics, but rather focuses on the conceptual flow of information and the relationships between different components.