## Diagram: Gemini Model Training and Refinement Pipeline
### Overview
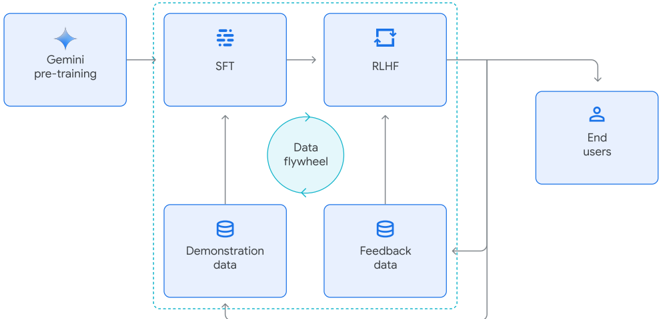
The image is a technical flowchart illustrating the machine learning pipeline for developing and refining the Gemini model. It depicts a sequential process starting from pre-training, moving through supervised fine-tuning (SFT) and reinforcement learning from human feedback (RLHF), and culminating in delivery to end users. A central "Data flywheel" component indicates a continuous feedback loop that improves the model using demonstration and feedback data.
### Components/Axes
The diagram consists of seven primary components represented as labeled boxes, connected by directional arrows indicating data or process flow. A dotted line encloses a central cluster of components.
**Components (from left to right, top to bottom):**
1. **Gemini pre-training** (Top-left): A light blue box with a four-pointed star icon.
2. **SFT** (Top-center, inside dotted box): A light blue box with a stacked layers icon. Label: "SFT".
3. **RLHF** (Top-right, inside dotted box): A light blue box with a circular arrows icon. Label: "RLHF".
4. **End users** (Far right): A light blue box with a person icon. Label: "End users".
5. **Demonstration data** (Bottom-left, inside dotted box): A light blue box with a database cylinder icon. Label: "Demonstration data".
6. **Feedback data** (Bottom-right, inside dotted box): A light blue box with a database cylinder icon. Label: "Feedback data".
7. **Data flywheel** (Center, inside dotted box): A teal circle with a circular arrows icon. Label: "Data flywheel".
**Grouping:** A dotted teal line forms a rectangle enclosing the SFT, RLHF, Demonstration data, Feedback data, and Data flywheel components, indicating they form an interconnected subsystem.
### Detailed Analysis
**Flow and Relationships:**
1. **Primary Training Path:** The process begins with "Gemini pre-training." An arrow points from this box to the "SFT" box.
2. **Sequential Refinement:** An arrow points from "SFT" to "RLHF," indicating supervised fine-tuning precedes reinforcement learning from human feedback.
3. **Output to Users:** An arrow points from "RLHF" to "End users," showing the refined model is deployed for user interaction.
4. **Feedback Loop Initiation:** A line originates from the "End users" box, travels downward, and splits. One branch points into the "Feedback data" box. This represents user interactions generating feedback.
5. **Data Flywheel Core:**
* The "Data flywheel" circle is centrally positioned within the dotted box.
* An arrow points from "Demonstration data" up to "SFT."
* An arrow points from "Feedback data" up to "RLHF."
* A circular arrow icon within the "Data flywheel" label suggests a continuous, self-reinforcing cycle.
6. **Loop Closure:** A line originates from the bottom of the dotted box (implying output from the flywheel process) and points back to the "Demonstration data" box. This completes the cycle, showing that processed feedback and demonstrations are used to generate new training data.
**Spatial Grounding:**
* The **legend/labels** are embedded directly within each component box.
* The **dotted boundary** is positioned centrally, grouping the core iterative training components.
* The **"Data flywheel"** is the geometric center of the dotted box, emphasizing its role as the engine of the loop.
* The **"End users"** box is isolated to the far right, outside the core training loop, representing the external deployment point.
### Key Observations
1. **Two-Stage Refinement:** The model undergoes two distinct post-pre-training stages: SFT (likely using demonstration data) and RLHF (using feedback data).
2. **Closed-Loop System:** The pipeline is not linear but cyclical. Outputs from end users are captured as feedback, which, combined with demonstration data, fuels a "flywheel" that presumably improves the data for the next iteration of SFT and RLHF.
3. **Data-Centric Design:** The explicit separation of "Demonstration data" and "Feedback data" highlights the importance of different data types for different training phases (SFT vs. RLHF).
4. **Central Orchestration:** The "Data flywheel" is visually and logically central, suggesting it's the mechanism for synthesizing, curating, or managing the flow of data between the storage components (Demonstration/Feedback data) and the training components (SFT/RLHF).
### Interpretation
This diagram illustrates a modern, iterative approach to large language model (LLM) development that goes beyond initial pre-training. The core insight is that deployment to end users is not the final step but the beginning of a continuous improvement cycle.
* **The "Flywheel" Metaphor:** The term "Data flywheel" is key. It implies a self-reinforcing system where:
1. A better model (from SFT/RLHF) is deployed.
2. It generates more (and potentially higher-quality) user interaction data.
3. This data is captured as feedback and demonstrations.
4. The data is used to further refine the model, making it even better.
5. The cycle repeats, with each turn "spinning" the flywheel faster, leading to accelerating improvements.
* **Peircean Investigative Lens:** From an abductive reasoning perspective (seeking the best explanation), this diagram explains *how* a model like Gemini maintains relevance and improves post-deployment. It posits that user feedback is not merely evaluative but is a primary *ingredient* for the next model version. The system is designed to learn from its own operational environment.
* **Notable Anomaly/Emphasis:** The diagram notably does not show a separate "evaluation" or "testing" phase before release to "End users." This suggests the pipeline embraces a "release early, learn often" philosophy, where real-world use is the primary testing ground, and the feedback loop is tightly integrated into the core training architecture. The dotted box signifies that the model's intelligence is not static but is continuously shaped by the data ecosystem it operates within.