## Line Graph: ε_opt vs α with σ₁, σ₂, σ₃
### Overview
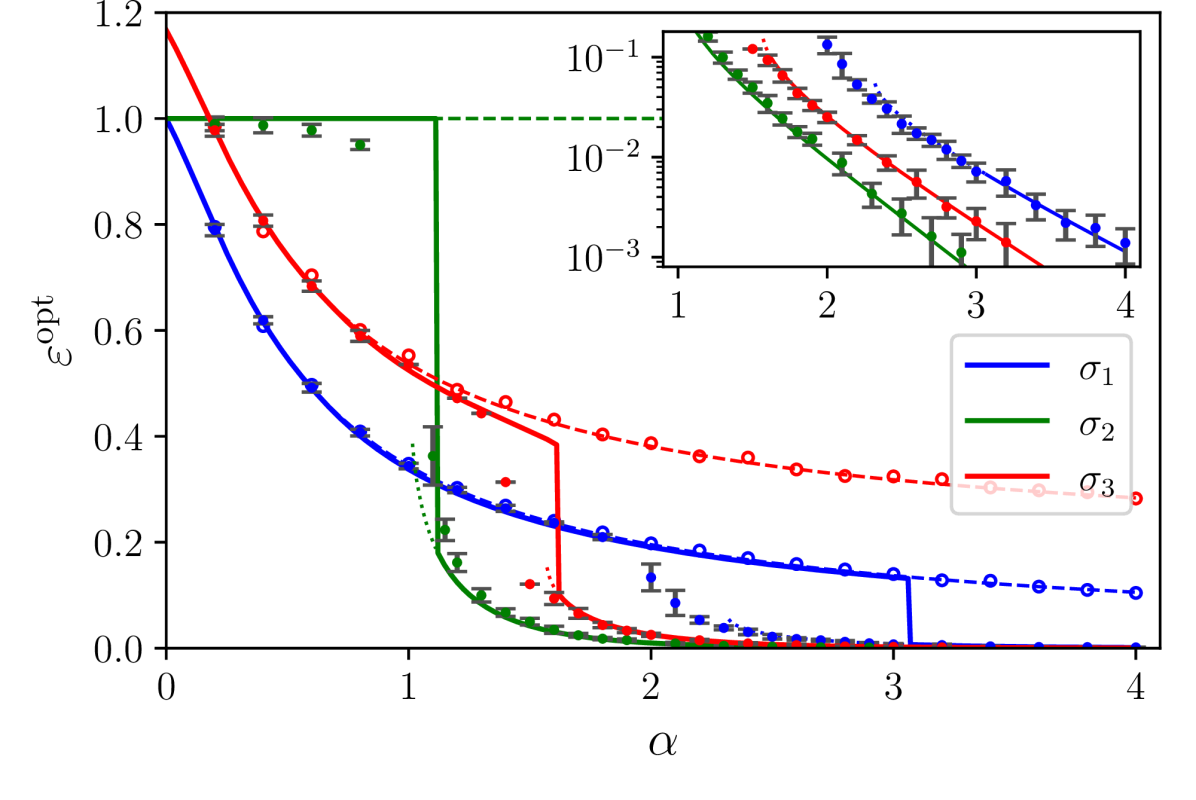
The graph depicts the relationship between ε_opt (y-axis) and α (x-axis) for three distinct σ values (σ₁, σ₂, σ₃). A secondary inset graph in the top-right corner provides a logarithmic-scale view of the same data. The primary graph shows exponential decay trends for all σ values, with σ₁ declining most sharply and σ₃ least.
### Components/Axes
- **Primary Graph**:
- **X-axis (α)**: Linear scale from 0 to 4, labeled "α".
- **Y-axis (ε_opt)**: Linear scale from 0.0 to 1.2, labeled "ε_opt".
- **Legend**: Located in the bottom-right corner, mapping:
- Blue line: σ₁
- Green line: σ₂
- Red line: σ₃
- **Inset Graph**:
- **X-axis (α)**: Same linear scale (0–4).
- **Y-axis**: Logarithmic scale from 10⁻³ to 10⁻¹, labeled "10⁻¹, 10⁻², 10⁻³".
### Detailed Analysis
1. **σ₁ (Blue Line)**:
- Starts at ε_opt = 1.0 when α = 0.
- Drops sharply to ~0.2 at α = 1, then plateaus.
- Data points (blue circles with error bars) align closely with the line, showing minimal deviation.
2. **σ₂ (Green Line)**:
- Starts at ε_opt = 1.0 when α = 0.
- Declines to ~0.4 at α = 1, then follows a gradual downward trend.
- Data points (green squares) match the line’s trajectory.
3. **σ₃ (Red Line)**:
- Starts at ε_opt = 1.0 when α = 0.
- Drops to ~0.6 at α = 1, then declines slowly.
- Data points (red circles) follow the line with slight scatter.
4. **Inset Graph**:
- All three lines (blue, green, red) are plotted on a logarithmic y-axis.
- Confirms exponential decay behavior, with σ₁ showing the steepest slope.
### Key Observations
- **Threshold at α = 1**: All σ values exhibit a sharp drop in ε_opt at α = 1, suggesting a critical transition point.
- **σ₁ Dominance**: σ₁’s ε_opt declines most rapidly, indicating higher sensitivity to α.
- **σ₃ Resilience**: σ₃ maintains the highest ε_opt across α > 1, suggesting stability.
- **Error Bars**: Small and consistent across all data points, implying precise measurements.
### Interpretation
The graph demonstrates that ε_opt decreases exponentially with increasing α for all σ values, but the rate of decay varies significantly. σ₁’s steep decline suggests it is highly sensitive to α, while σ₃’s gradual drop implies robustness. The inset’s logarithmic scale highlights the exponential nature of the decay, which may be critical for modeling systems where small α changes have large impacts. The threshold at α = 1 could represent a phase transition or operational limit in the studied system. The consistent error bars across all σ values indicate reliable experimental or simulated data.