TECHNICAL ASSET FINGERPRINT
05b4e66fe5894e2e539a8a21
Click to view fullscreen
Press ESC or click to close
FOUND IN PAPERS
EXPERT: gemini-2.5-flash-free VERSION 1
RUNTIME: google-free/gemini-2.5-flash
INTEL_VERIFIED
## Chart Type: Multi-Panel Parametric Study of System Metrics
### Overview
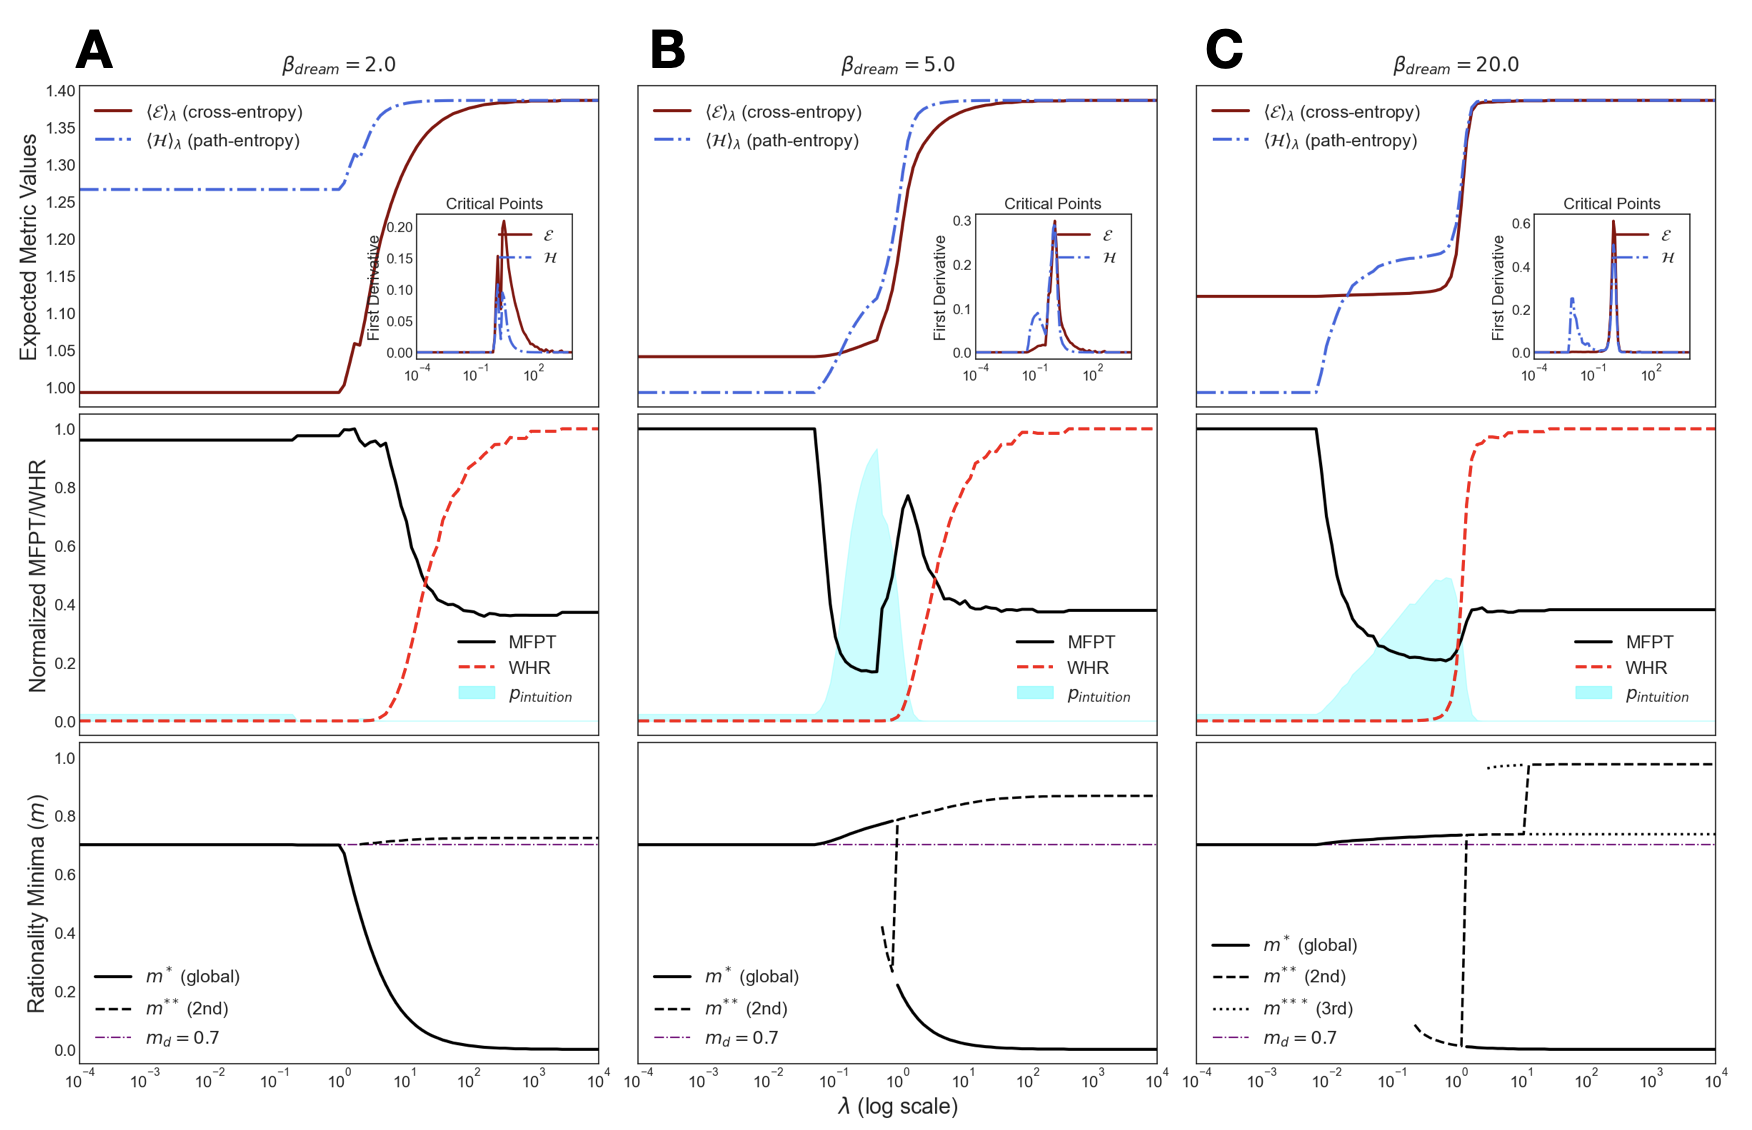
This image presents a 3x3 grid of line plots, organized into three columns (A, B, C) and three rows. Each column represents a different value of the parameter `β_dream` (2.0, 5.0, and 20.0, respectively). Each row displays different sets of metrics as a function of `λ` on a logarithmic scale. The plots illustrate how various system properties, including entropy, performance metrics (MFPT/WHR), and rationality minima, change with `λ` and how these changes are influenced by `β_dream`. Inset plots in the top row show the first derivatives of the entropy metrics, highlighting critical points.
### Components/Axes
**Global Labels:**
* **Column Headers (Top-Center):**
* **A:** `β_dream = 2.0`
* **B:** `β_dream = 5.0`
* **C:** `β_dream = 20.0`
* **Global X-axis Label (Bottom-Center):** `λ (log scale)` (applies to all plots in the bottom row, and implicitly to all plots as they share the same x-axis range).
* **X-axis Range:** From `10^-4` to `10^4`.
**Row-Specific Y-axis Labels (Left-Center):**
* **Top Row:** `Expected Metric Values`
* **Y-axis Range:** From `0.95` to `1.40`.
* **Middle Row:** `Normalized MFPT/WHR`
* **Y-axis Range:** From `0.0` to `1.0`.
* **Bottom Row:** `Rationality Minima (m)`
* **Y-axis Range:** From `0.0` to `1.0`.
**Legends (Specific to each plot or row):**
**Top Row Plots (A1, B1, C1):**
* **Legend (Top-Left):**
* Solid brown line: `⟨E⟩_λ (cross-entropy)`
* Dash-dot blue line: `⟨H⟩_λ (path-entropy)`
* **Inset Plot (Top-Right):** `Critical Points`
* **Inset Y-axis Label:** `First Derivative`
* **Inset X-axis Label:** `λ`
* **Inset Y-axis Range:**
* A1: `0.00` to `0.20`
* B1: `0.0` to `0.3`
* C1: `0.0` to `0.6`
* **Inset X-axis Range:** `10^-4` to `10^2`
* **Inset Legend (Top-Right):**
* Solid brown line: `E`
* Dash-dot blue line: `H`
**Middle Row Plots (A2, B2, C2):**
* **Legend (Bottom-Right):**
* Solid black line: `MFPT`
* Dashed red line: `WHR`
* Light blue shaded area: `p_intuition`
**Bottom Row Plots (A3, B3, C3):**
* **Legend (Bottom-Left):**
* Solid black line: `m* (global)`
* Dashed black line: `m** (2nd)`
* Dash-dot purple line: `m_d = 0.7`
* **Additional for C3 only:** Dotted black line: `m*** (3rd)`
### Detailed Analysis
**Column A: `β_dream = 2.0`**
* **A1: Expected Metric Values**
* **⟨E⟩_λ (cross-entropy)** (solid brown): Starts around 0.98, remains flat until approximately `λ = 10^0` (1), then increases sharply, reaching approximately 1.38 by `λ = 10^1` and flattening out.
* **⟨H⟩_λ (path-entropy)** (dash-dot blue): Starts around 1.27, remains flat until approximately `λ = 10^0` (1), then increases sharply, reaching approximately 1.38 by `λ = 10^1` and flattening out.
* **Inset (Critical Points):**
* **E (solid brown):** Shows a sharp peak in its first derivative, reaching a maximum of approximately 0.20 at `λ` around `10^0.5` (approx. 3-4).
* **H (dash-dot blue):** Shows a sharp peak in its first derivative, reaching a maximum of approximately 0.15 at `λ` around `10^0.5` (approx. 3-4).
* **A2: Normalized MFPT/WHR**
* **MFPT (solid black):** Starts around 0.98, remains flat until approximately `λ = 10^0` (1), then drops sharply, reaching approximately 0.40 by `λ = 10^1` and flattening out.
* **WHR (dashed red):** Starts around 0.02, remains flat until approximately `λ = 10^0` (1), then increases sharply, reaching approximately 0.98 by `λ = 10^1` and flattening out.
* **p_intuition (light blue shaded area):** Appears as a very thin, almost negligible shaded region near the x-axis, suggesting a very low probability of intuition.
* **A3: Rationality Minima (m)**
* **m* (global) (solid black):** Starts around 0.70, remains flat until approximately `λ = 10^0` (1), then drops sharply, reaching near 0.0 by `λ = 10^1` and flattening out.
* **m** (2nd) (dashed black): Starts around 0.70, remains flat, then slightly increases to approximately 0.72 around `λ = 10^0`, then drops sharply to near 0.0, then increases sharply to approximately 0.72 by `λ = 10^1` and flattens. For `λ < 10^0`, it is mostly obscured by `m*`.
* **m_d = 0.7 (dash-dot purple):** A horizontal reference line at `m = 0.7`.
**Column B: `β_dream = 5.0`**
* **B1: Expected Metric Values**
* **⟨E⟩_λ (cross-entropy)** (solid brown): Starts around 0.98, remains flat until approximately `λ = 10^-0.5` (approx. 0.3), then increases sharply, reaching approximately 1.38 by `λ = 10^0.5` (approx. 3) and flattening out. The transition is steeper and shifted left compared to A1.
* **⟨H⟩_λ (path-entropy)** (dash-dot blue): Starts around 1.27, remains flat until approximately `λ = 10^-0.5` (approx. 0.3), then increases sharply, reaching approximately 1.38 by `λ = 10^0.5` (approx. 3) and flattening out. The transition is steeper and shifted left compared to A1.
* **Inset (Critical Points):**
* **E (solid brown):** Shows a sharper peak, reaching approximately 0.28 at `λ` around `10^-0.2` (approx. 0.6).
* **H (dash-dot blue):** Shows a sharper peak, reaching approximately 0.22 at `λ` around `10^-0.2` (approx. 0.6). Peaks are taller and narrower than in A1.
* **B2: Normalized MFPT/WHR**
* **MFPT (solid black):** Starts around 0.98, remains flat until approximately `λ = 10^-0.5` (approx. 0.3), then drops sharply to a minimum of approximately 0.15, then rises to approximately 0.40, then drops again to approximately 0.15, then rises to approximately 0.40 and flattens. This shows a complex, oscillatory behavior during the transition.
* **WHR (dashed red):** Starts around 0.02, remains flat until approximately `λ = 10^-0.5` (approx. 0.3), then increases sharply, reaching approximately 0.98 by `λ = 10^0.5` (approx. 3) and flattening out. Similar to A2 but shifted left and steeper.
* **p_intuition (light blue shaded area):** Appears as a significant shaded region, peaking around `λ = 10^-0.2` (approx. 0.6), with a complex, multi-modal shape, suggesting a region of non-zero intuition probability during the transition.
* **B3: Rationality Minima (m)**
* **m* (global) (solid black):** Starts around 0.70, remains flat until approximately `λ = 10^-0.5` (approx. 0.3), then drops sharply, reaching near 0.0 by `λ = 10^0.5` (approx. 3) and flattening out.
* **m** (2nd) (dashed black): Starts around 0.70, remains flat, then increases slightly to approximately 0.72 around `λ = 10^-0.5`, then drops sharply to near 0.0, then increases sharply to approximately 0.72 by `λ = 10^0.5` (approx. 3) and flattens. This line shows a distinct jump.
* **m_d = 0.7 (dash-dot purple):** A horizontal reference line at `m = 0.7`.
**Column C: `β_dream = 20.0`**
* **C1: Expected Metric Values**
* **⟨E⟩_λ (cross-entropy)** (solid brown): Starts around 0.98, remains flat until approximately `λ = 10^-1` (0.1), then increases sharply, reaching approximately 1.38 by `λ = 10^0` (1) and flattening out. The transition is even steeper and shifted further left compared to B1.
* **⟨H⟩_λ (path-entropy)** (dash-dot blue): Starts around 1.27, remains flat until approximately `λ = 10^-1` (0.1), then increases sharply, reaching approximately 1.38 by `λ = 10^0` (1) and flattening out. The transition is even steeper and shifted further left compared to B1.
* **Inset (Critical Points):**
* **E (solid brown):** Shows a very sharp peak, reaching approximately 0.58 at `λ` around `10^-0.5` (approx. 0.3).
* **H (dash-dot blue):** Shows a very sharp peak, reaching approximately 0.48 at `λ` around `10^-0.5` (approx. 0.3). Peaks are taller and narrower than in B1.
* **C2: Normalized MFPT/WHR**
* **MFPT (solid black):** Starts around 0.98, remains flat until approximately `λ = 10^-1` (0.1), then drops sharply to a minimum of approximately 0.15, then rises to approximately 0.40, then drops again to approximately 0.15, then rises to approximately 0.40 and flattens. Similar complex oscillatory behavior as B2, but shifted left and potentially more pronounced.
* **WHR (dashed red):** Starts around 0.02, remains flat until approximately `λ = 10^-1` (0.1), then increases sharply, reaching approximately 0.98 by `λ = 10^0` (1) and flattening out. Similar to B2 but shifted left and steeper.
* **p_intuition (light blue shaded area):** Appears as a significant shaded region, peaking around `λ = 10^-0.5` (approx. 0.3), with a complex, multi-modal shape, suggesting a region of non-zero intuition probability. The area appears wider and potentially higher than in B2.
* **C3: Rationality Minima (m)**
* **m* (global) (solid black):** Starts around 0.70, remains flat until approximately `λ = 10^-1` (0.1), then drops sharply, reaching near 0.0 by `λ = 10^0` (1) and flattening out.
* **m** (2nd) (dashed black): Starts around 0.70, remains flat, then drops sharply to near 0.0, then jumps to approximately 0.72, then drops again to near 0.0, then jumps to approximately 0.72 and flattens. This line shows multiple sharp transitions.
* **m*** (3rd) (dotted black): Starts near 0.0, remains flat, then jumps to approximately 0.72 around `λ = 10^0` (1), then drops to near 0.0, then jumps to approximately 0.72 and flattens. This third minimum is only visible in this panel.
* **m_d = 0.7 (dash-dot purple):** A horizontal reference line at `m = 0.7`.
### Key Observations
* **Phase Transition:** All metrics across all `β_dream` values exhibit a clear phase transition as `λ` increases.
* **Influence of `β_dream`:** Increasing `β_dream` (from 2.0 to 20.0) consistently shifts the transition point to lower `λ` values. It also makes the transitions steeper, as evidenced by the taller and narrower peaks in the "First Derivative" inset plots.
* **Entropy Behavior:** Both cross-entropy and path-entropy increase after the transition, suggesting a shift to a state with higher complexity or uncertainty.
* **Performance Trade-off:** MFPT (Mean First Passage Time) decreases while WHR (Weighted Hitting Rate) increases, indicating that the system becomes more efficient or faster at reaching a target state after the transition.
* **Emergence of Intuition:** The `p_intuition` region becomes more prominent and complex (multi-modal) for higher `β_dream` values, suggesting that "intuition" plays a more significant role during the transition phase when `β_dream` is high.
* **Rationality Minima Complexity:** For higher `β_dream`, the behavior of the rationality minima becomes more complex, with the emergence of a third minimum (`m***`) and more pronounced jumps in `m**`, indicating a richer landscape of possible rational behaviors or states. The global minimum `m*` consistently drops to near zero after the transition.
### Interpretation
The data suggests that `λ` acts as a control parameter driving a fundamental shift in the system's behavior. This shift is characterized by an increase in entropy (both cross and path), an improvement in performance (lower MFPT, higher WHR), and a change in the landscape of rationality minima.
The parameter `β_dream` appears to modulate the "ease" or "speed" of this transition. Higher `β_dream` values cause the transition to occur at lower `λ` values, implying that the system becomes more sensitive to `λ` and undergoes the shift more readily. Furthermore, higher `β_dream` values introduce more complex dynamics during the transition, particularly evident in the oscillatory behavior of MFPT and the multi-modal `p_intuition` region. This suggests that `β_dream` might represent a factor that enhances the system's capacity for "intuitive" or non-trivial decision-making during critical periods of change.
The behavior of the rationality minima (m*, m**, m***) indicates that the system's optimal rational state (m*) shifts from a higher value (around 0.7) to a lower value (near 0) after the transition. The presence and complex dynamics of secondary and tertiary minima (m**, m***) for higher `β_dream` values suggest that the system might explore multiple sub-optimal rational strategies or exhibit bifurcations during the transition, especially when `β_dream` is high. The `p_intuition` peaks align with these complex transitions, implying that "intuition" might be a mechanism that helps the system navigate these complex landscapes of rationality minima, potentially by facilitating jumps between different stable states or by exploring non-rational pathways during the phase shift.
In essence, the plots illustrate a system undergoing a phase transition driven by `λ`, where `β_dream` acts as a catalyst, accelerating the transition, making it sharper, and enriching the underlying dynamics, particularly by enabling a more prominent role for "intuition" and a more complex interplay of rational minima.
DECODING INTELLIGENCE...