TECHNICAL ASSET FINGERPRINT
05b4e66fe5894e2e539a8a21
Click to view fullscreen
Press ESC or click to close
FOUND IN PAPERS
EXPERT: gemma-3-27b-it-free VERSION 1
RUNTIME: google-free/gemma-3-27b-it
INTEL_VERIFIED
## Chart: Expected Metric Values vs. Log Scale Lambda
### Overview
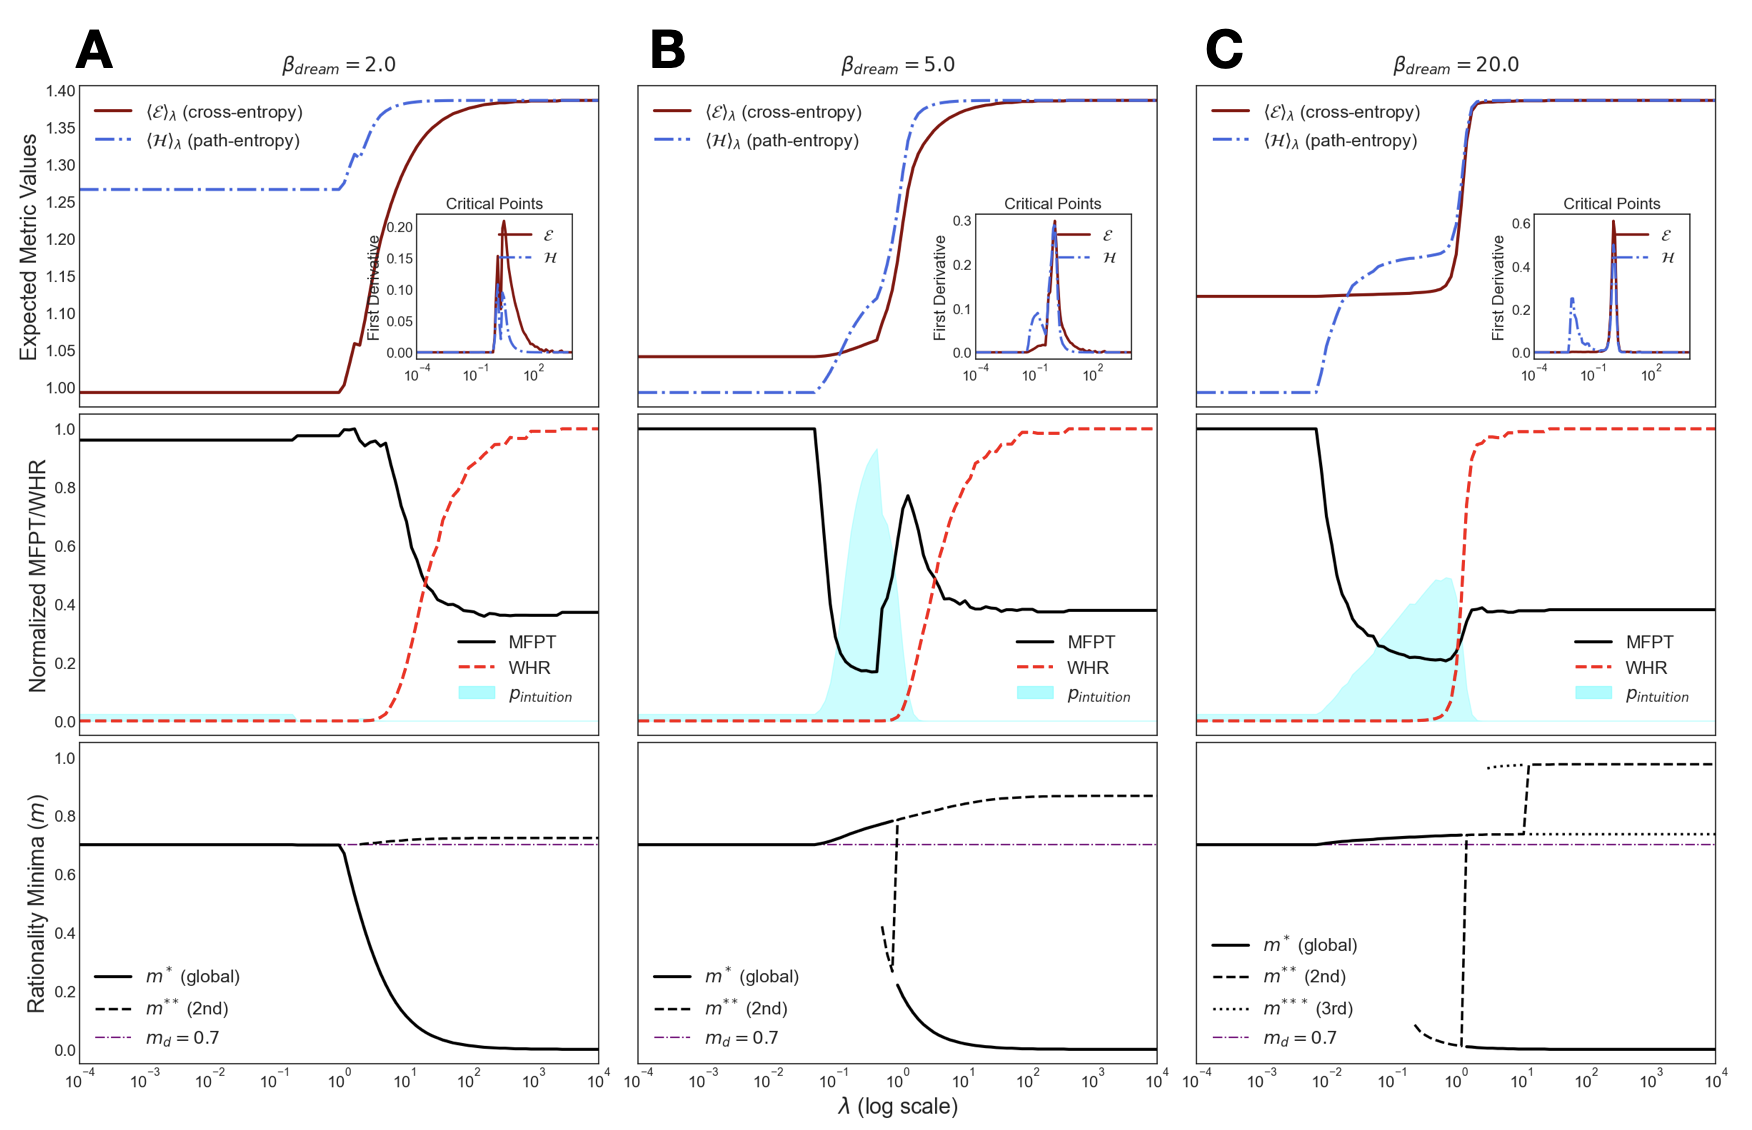
The image presents three panels (A, B, and C) each displaying a series of plots illustrating the relationship between Expected Metric Values (top), Normalized MFPT/WHR (middle), and Rationality Minima (bottom) against a log scale lambda (λ). Each panel corresponds to a different value of βdream (2.0, 5.0, and 20.0 respectively). Each panel contains three main plots, with insets showing the first derivative of the expected metric values.
### Components/Axes
* **X-axis (all panels):** λ (log scale), ranging from 10^-4 to 10^1.
* **Y-axis (Panel A):** Expected Metric Values, ranging from 0.0 to 1.40.
* **Y-axis (Panel B):** Expected Metric Values, ranging from 0.0 to 0.30.
* **Y-axis (Panel C):** Expected Metric Values, ranging from 0.0 to 0.6.
* **Y-axis (Middle plots, all panels):** Normalized MFPT/WHR, ranging from 0.0 to 1.10.
* **Y-axis (Bottom plots, all panels):** Rationality Minima (m'), ranging from 0.0 to 0.2.
* **Legend (all panels):**
* MFPT (solid blue line)
* WHR (dashed red line)
* P Intuition (dotted green line)
* **Inset Plots (all panels):** First Derivative vs. λ, with labels 'ε' (solid blue line) and 'H' (dashed red line).
* **Panel Labels:** A (βdream = 2.0), B (βdream = 5.0), C (βdream = 20.0).
* **Bottom of each panel:** m* (global) (solid black line), m**(2nd) (dashed black line), m**(3rd) (dotted black line), mθ = 0.7 (horizontal black line).
### Detailed Analysis or Content Details
**Panel A (βdream = 2.0):**
* **Expected Metric Values:** The MFPT line (blue) starts at approximately 1.35 and decreases to around 0.25. The WHR line (red) starts at approximately 1.10 and decreases to around 0.15. The P Intuition line (green) starts at approximately 0.45 and decreases to around 0.05.
* **Normalized MFPT/WHR:** The MFPT line (blue) starts at approximately 1.05 and decreases to around 0.2. The WHR line (red) starts at approximately 0.95 and decreases to around 0.1. The P Intuition line (green) starts at approximately 0.5 and decreases to around 0.02.
* **Rationality Minima:** m* (global) (black solid) starts at approximately 0.15 and decreases to around 0.01. m**(2nd) (black dashed) starts at approximately 0.10 and decreases to around 0.005. m**(3rd) (black dotted) starts at approximately 0.05 and remains near 0.002. mθ = 0.7 is a horizontal line at 0.7.
* **Inset:** The first derivative of ε (blue) shows a peak around λ = 0.01, decreasing to near zero. The first derivative of H (red) shows a peak around λ = 0.1, decreasing to near zero.
**Panel B (βdream = 5.0):**
* **Expected Metric Values:** The MFPT line (blue) starts at approximately 0.25 and decreases to around 0.05. The WHR line (red) starts at approximately 0.20 and decreases to around 0.03. The P Intuition line (green) starts at approximately 0.10 and decreases to around 0.01.
* **Normalized MFPT/WHR:** The MFPT line (blue) starts at approximately 0.9 and decreases to around 0.1. The WHR line (red) starts at approximately 0.8 and decreases to around 0.05. The P Intuition line (green) starts at approximately 0.4 and decreases to around 0.01.
* **Rationality Minima:** m* (global) (black solid) starts at approximately 0.10 and decreases to around 0.005. m**(2nd) (black dashed) starts at approximately 0.05 and decreases to around 0.002. m**(3rd) (black dotted) starts at approximately 0.02 and remains near 0.001. mθ = 0.7 is a horizontal line at 0.7.
* **Inset:** The first derivative of ε (blue) shows a peak around λ = 0.01, decreasing to near zero. The first derivative of H (red) shows a peak around λ = 0.1, decreasing to near zero.
**Panel C (βdream = 20.0):**
* **Expected Metric Values:** The MFPT line (blue) starts at approximately 0.50 and decreases to around 0.05. The WHR line (red) starts at approximately 0.40 and decreases to around 0.03. The P Intuition line (green) starts at approximately 0.20 and decreases to around 0.01.
* **Normalized MFPT/WHR:** The MFPT line (blue) starts at approximately 1.0 and decreases to around 0.2. The WHR line (red) starts at approximately 0.9 and decreases to around 0.1. The P Intuition line (green) starts at approximately 0.5 and decreases to around 0.02.
* **Rationality Minima:** m* (global) (black solid) starts at approximately 0.15 and decreases to around 0.01. m**(2nd) (black dashed) starts at approximately 0.10 and decreases to around 0.005. m**(3rd) (black dotted) starts at approximately 0.05 and remains near 0.002. mθ = 0.7 is a horizontal line at 0.7.
* **Inset:** The first derivative of ε (blue) shows a peak around λ = 0.01, decreasing to near zero. The first derivative of H (red) shows a peak around λ = 0.1, decreasing to near zero.
### Key Observations
* As βdream increases (from A to C), the overall magnitude of the Expected Metric Values decreases.
* In all panels, the MFPT line consistently remains above the WHR line, which in turn remains above the P Intuition line.
* The Rationality Minima plots show a consistent pattern of decreasing values for m* (global), m**(2nd), and m**(3rd) as λ increases.
* The insets consistently show peaks in the first derivatives of ε and H, indicating points of maximum change in the respective metric values.
### Interpretation
The charts demonstrate the impact of varying βdream values on expected metric values, normalized MFPT/WHR, and rationality minima. The decreasing magnitude of the expected metric values with increasing βdream suggests a diminishing return or increased cost associated with higher βdream values. The consistent ordering of the MFPT, WHR, and P Intuition lines indicates a hierarchical relationship between these metrics, potentially reflecting different levels of cognitive effort or complexity. The decreasing rationality minima suggest that as λ increases, the system converges towards a more rational state, but the rate of convergence varies depending on the order of the minima (global, 2nd, 3rd). The insets provide insights into the rate of change of the expected metric values, highlighting the points where the system is most sensitive to changes in λ. The horizontal line at mθ = 0.7 provides a reference point for assessing the rationality of the system. The consistent shape of the derivative plots across the panels suggests that the underlying dynamics are relatively stable, despite the changes in βdream. The data suggests a complex interplay between these metrics and the parameter βdream, with implications for understanding decision-making processes and cognitive biases.
DECODING INTELLIGENCE...