TECHNICAL ASSET FINGERPRINT
05b4e66fe5894e2e539a8a21
Click to view fullscreen
Press ESC or click to close
FOUND IN PAPERS
EXPERT: healer-alpha-free VERSION 1
RUNTIME: free/openrouter/healer-alpha
INTEL_VERIFIED
\n
## Multi-Panel Line Graph Analysis: Entropy Metrics, First-Passage Times, and Rationality Minima
### Overview
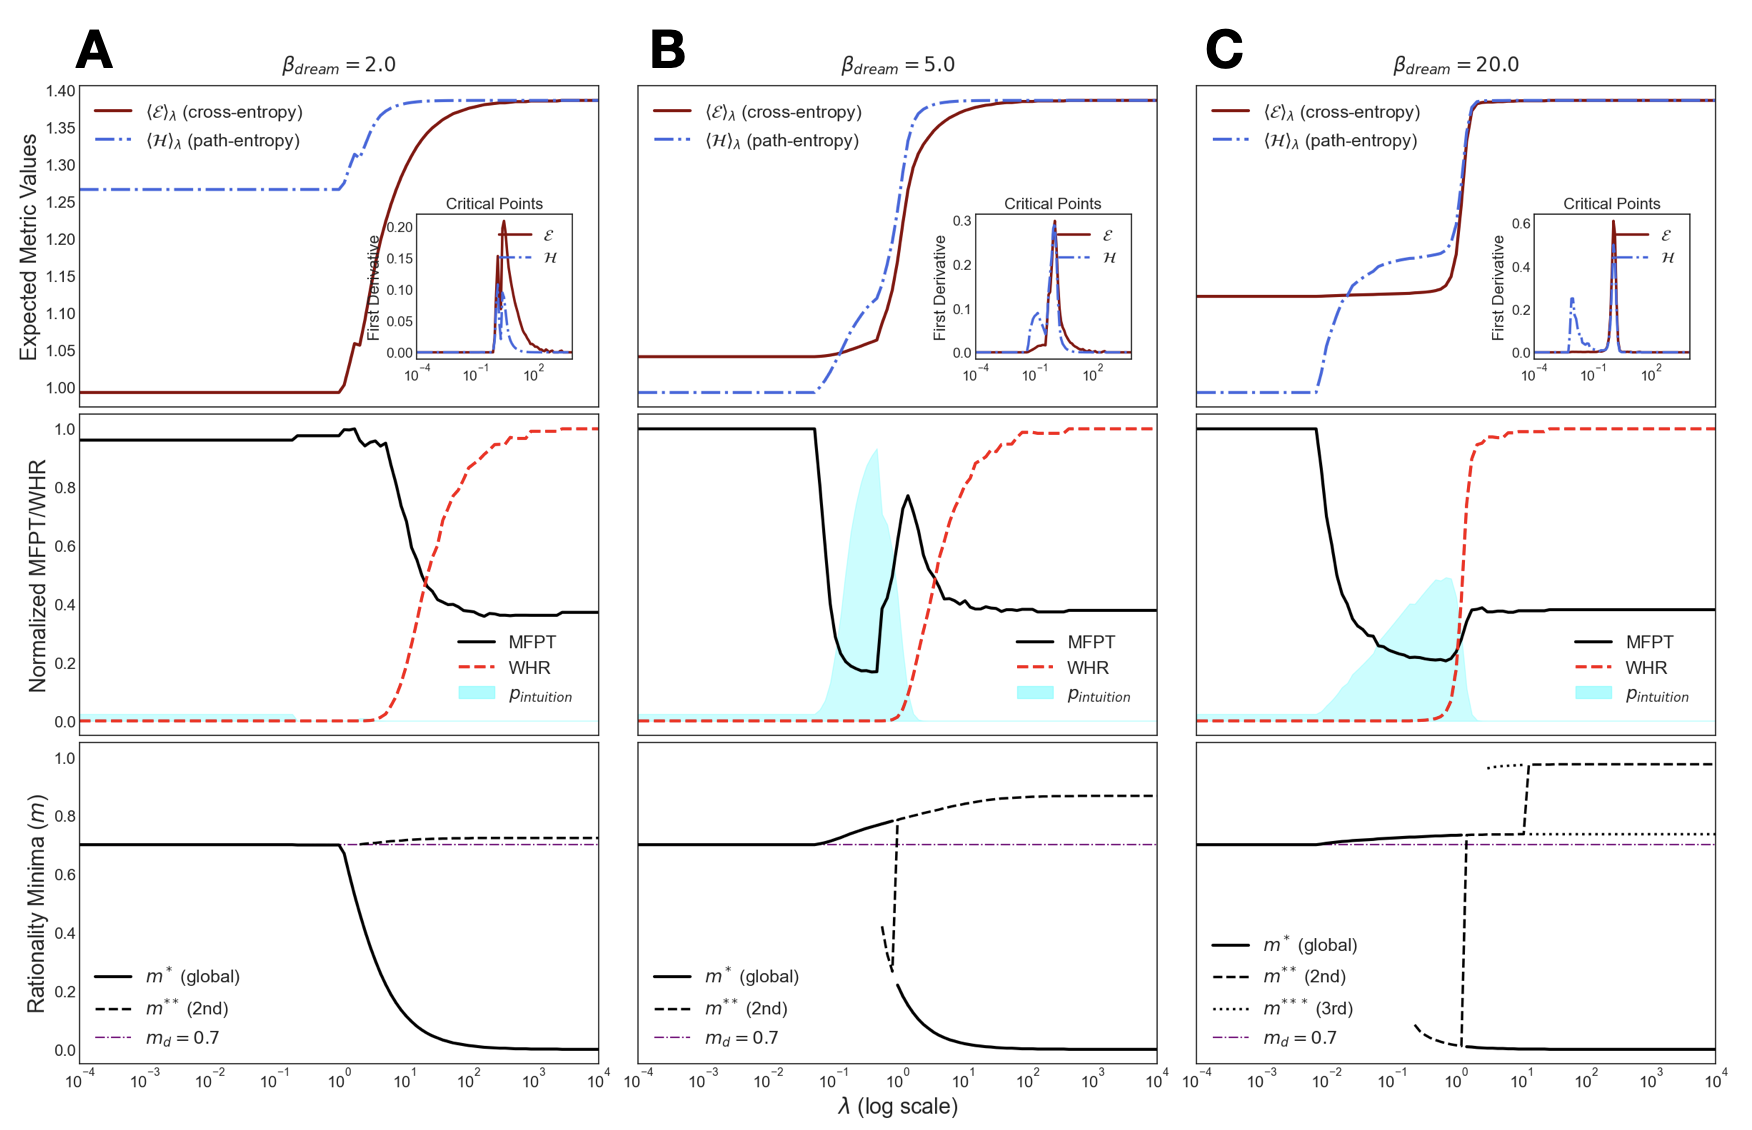
The image is a composite figure containing three main panels (A, B, C), each displaying a set of three vertically stacked line graphs. The panels compare system behavior under three different values of a parameter labeled `β_dream` (2.0, 5.0, and 20.0). The graphs plot various metrics against a common x-axis, `λ` (log scale), which likely represents a control parameter or inverse temperature. The figure appears to be from a scientific or technical paper analyzing phase transitions, decision-making, or optimization processes.
### Components/Axes
**Global Structure:**
* **Three Main Panels:** Labeled **A**, **B**, and **C** in the top-left corner of each panel.
* **Panel Titles:** Each panel has a title indicating the `β_dream` value: `β_dream = 2.0` (A), `β_dream = 5.0` (B), `β_dream = 20.0` (C).
* **Common X-Axis:** All nine subplots share the same x-axis label at the bottom: `λ (log scale)`. The axis is logarithmic, with major tick marks at `10^-4`, `10^-3`, `10^-2`, `10^-1`, `10^0`, `10^1`, `10^2`, `10^3`, `10^4`.
* **Vertical Layout per Panel:** Each panel (A, B, C) contains three subplots stacked vertically.
**Subplot Details (Common to all panels, y-axes differ):**
1. **Top Subplot:**
* **Y-Axis Label:** `Expected Metric Values`.
* **Legend (Top-Left):**
* Solid dark red line: `⟨ℰ⟩_λ (cross-entropy)`
* Dash-dot blue line: `⟨H⟩_λ (path-entropy)`
* **Inset Plot (Center-Right):** A smaller plot titled `Critical Points`.
* **Y-Axis Label:** `First Derivative`.
* **Legend:** Solid dark red line: `ℰ`; Dash-dot blue line: `H`.
* **X-Axis:** Same log scale as the main plot (`10^-4` to `10^2`).
2. **Middle Subplot:**
* **Y-Axis Label:** `Normalized MFPT/WHR`.
* **Legend (Bottom-Right):**
* Solid black line: `MFPT`
* Dashed red line: `WHR`
* Light cyan shaded area: `P_intuition`
3. **Bottom Subplot:**
* **Y-Axis Label:** `Rationality Minima (m)`.
* **Legend (Bottom-Left):**
* Solid black line: `m* (global)`
* Dashed black line: `m** (2nd)`
* Dash-dot purple line: `m_d = 0.7` (a constant reference line).
* **Panel C only:** An additional dotted black line: `m*** (3rd)`.
### Detailed Analysis
**Panel A (β_dream = 2.0):**
* **Top (Entropy):** Both `⟨ℰ⟩_λ` and `⟨H⟩_λ` start at a low, constant value (~1.00 and ~1.27 respectively) for `λ < 10^0`. They undergo a sharp, sigmoidal increase between `λ ≈ 10^0` and `λ ≈ 10^1`, saturating at a high constant value (~1.38). The `⟨H⟩_λ` curve rises slightly earlier than `⟨ℰ⟩_λ`. The inset shows the first derivatives of both metrics peak sharply in the transition region (`λ ≈ 10^0`), with the `ℰ` peak being taller and narrower than the `H` peak.
* **Middle (MFPT/WHR):** `MFPT` starts high (~0.95), remains stable until `λ ≈ 10^0`, then drops sharply to a low plateau (~0.38) by `λ ≈ 10^1`. `WHR` starts at 0, begins rising at `λ ≈ 10^0`, and saturates at 1.0 by `λ ≈ 10^1`. The cyan `P_intuition` shaded region is a narrow peak centered around `λ ≈ 10^0.5` (approx. 3), coinciding with the crossover point of the MFPT and WHR curves.
* **Bottom (Rationality):** `m* (global)` starts at ~0.7, begins a smooth decline at `λ ≈ 10^0`, and approaches 0 by `λ ≈ 10^2`. `m** (2nd)` is a constant line at ~0.72, slightly above the initial `m*`. The `m_d = 0.7` reference line is constant.
**Panel B (β_dream = 5.0):**
* **Top (Entropy):** Similar sigmoidal transition as Panel A, but it occurs at a lower `λ` value (starting around `λ ≈ 10^-1`). The saturation values appear similar. The inset derivative peaks are now located at `λ ≈ 10^-1`. The `H` derivative shows a small secondary bump before the main peak.
* **Middle (MFPT/WHR):** The transition is more complex. `MFPT` starts high (~1.0), drops sharply at `λ ≈ 10^-1`, but then exhibits a pronounced non-monotonic "bump" or local maximum between `λ ≈ 10^0` and `λ ≈ 10^1` before settling to its low plateau. `WHR` rises from 0 starting at `λ ≈ 10^-1` and saturates at 1.0. The `P_intuition` region is broader and more complex, with a main peak under the MFPT drop and a secondary lobe under the MFPT bump.
* **Bottom (Rationality):** `m* (global)` starts at ~0.7, begins declining at `λ ≈ 10^-1`, and approaches 0. `m** (2nd)` now shows a dynamic behavior: it starts at ~0.7, rises to ~0.85 by `λ ≈ 10^1`, and then plateaus. The `m_d = 0.7` line remains constant.
**Panel C (β_dream = 20.0):**
* **Top (Entropy):** The sigmoidal transition is even sharper and occurs at the lowest `λ` (starting before `λ ≈ 10^-2`). The curves appear almost step-like. The inset derivative peaks are very sharp and located at `λ ≈ 10^-2`. The `H` derivative shows a distinct double-peak structure.
* **Middle (MFPT/WHR):** The `MFPT` drop is very steep, occurring at `λ ≈ 10^-2`. The non-monotonic bump seen in Panel B is absent; the curve drops directly to its low plateau. `WHR` rises sharply at the same `λ`. The `P_intuition` region is a single, sharp peak aligned with the transition.
* **Bottom (Rationality):** `m* (global)` starts at ~0.7 and drops to 0 very sharply at `λ ≈ 10^-2`. `m** (2nd)` starts at ~0.7, rises sharply to ~0.95 at `λ ≈ 10^0`, and then plateaus. A new `m*** (3rd)` line appears, starting at ~0.1 at `λ ≈ 10^-1`, jumping to ~0.95 at `λ ≈ 10^0`, and plateauing. The `m_d = 0.7` line is constant.
### Key Observations
1. **Phase Transition Shift:** As `β_dream` increases from 2.0 to 20.0, the critical transition point (where metrics change sharply) shifts to lower values of `λ` (from ~10^0 to ~10^-2).
2. **Transition Sharpness:** The transitions in both entropy and MFPT/WHR become sharper and more step-like with increasing `β_dream`.
3. **Complexity in Intermediate β:** Panel B (`β_dream=5.0`) shows the most complex behavior in the middle subplot, with a non-monotonic MFPT curve and a broad, multi-lobed `P_intuition` region. This suggests an intermediate regime with competing effects.
4. **Rationality Hierarchy:** The number of distinct rationality minima (`m*`, `m**`, `m***`) that become relevant increases with `β_dream`. In Panel C, a third minimum (`m***`) emerges.
5. **Correlation of Features:** The peaks in the derivative insets (top subplots) align with the `λ` values where the main entropy curves, MFPT/WHR curves, and `P_intuition` regions show their most dramatic changes.
### Interpretation
This figure illustrates the behavior of a system governed by a parameter `λ` under different "dream" or exploration intensities (`β_dream`). The data suggests a **phase transition** from one regime (low `λ`) to another (high `λ`).
* **Low `λ` Regime:** Characterized by low entropy (ordered state), high Mean First-Passage Time (MFPT, suggesting slow dynamics or high resistance), low Winning Hit Rate (WHR, poor performance), and a single dominant rationality minimum (`m*`).
* **High `λ` Regime:** Characterized by high entropy (disordered or exploratory state), low MFPT (fast dynamics), high WHR (good performance), and the emergence of multiple rationality minima (`m**`, `m***`), indicating a more complex decision landscape.
* **Role of `β_dream`:** This parameter controls the **location and sharpness** of the transition. Higher `β_dream` makes the system switch between regimes at a lower `λ` value and in a more abrupt, discontinuous manner. The intermediate `β_dream=5.0` reveals a richer structure, possibly indicating a region where ordered and disordered phases coexist or compete, leading to the non-monotonic MFPT and broad intuition peak.
* **`P_intuition`:** This shaded region likely represents the parameter space where an intuitive or heuristic strategy is most effective or probable. Its peak coincides with the phase transition, suggesting intuition is most valuable when the system is poised between order and disorder.
In essence, the figure maps out how increasing exploratory pressure (`β_dream`) shifts and sharpens a fundamental transition in system dynamics, performance, and the underlying rational structure, with intuition playing a key role at the critical point.
DECODING INTELLIGENCE...