## Line Plots with Multiple Metrics Across β_dream Values
### Overview
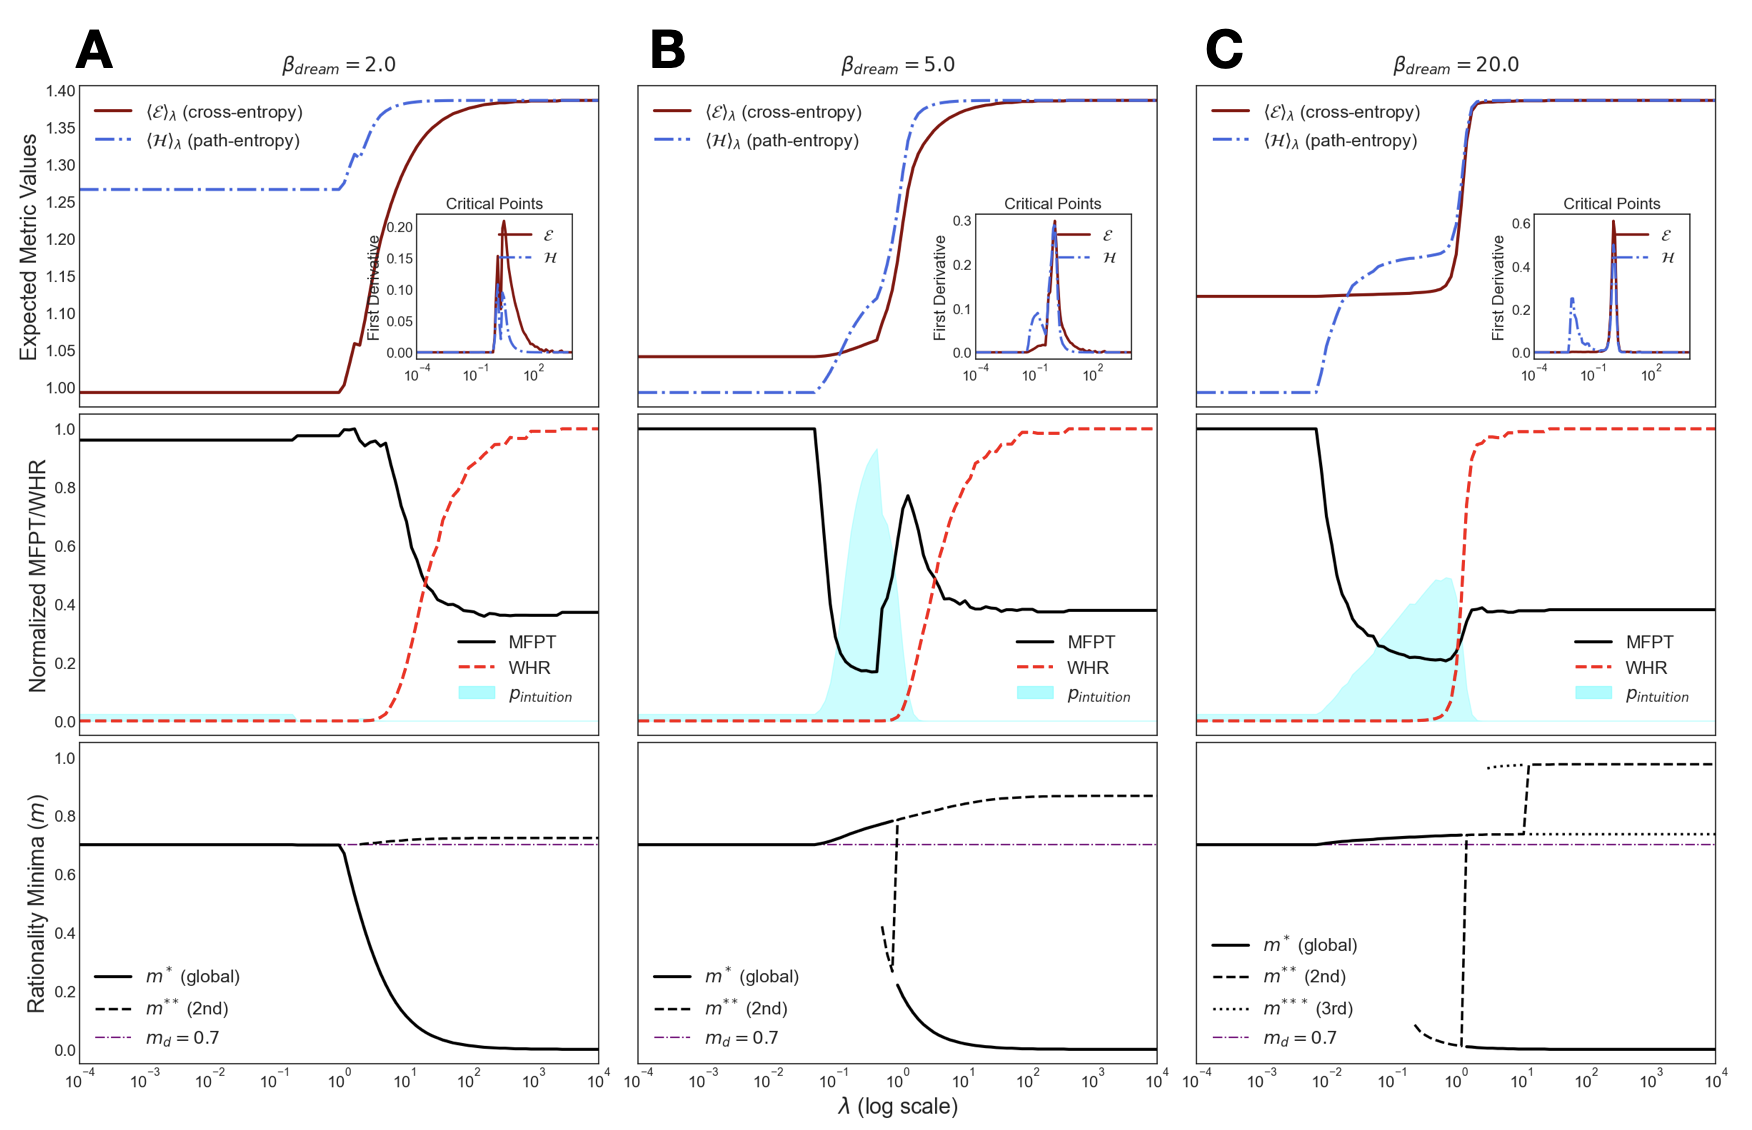
The image presents three sets of line plots (A, B, C) corresponding to β_dream values of 2.0, 5.0, and 20.0. Each set contains three subplots:
1. Cross-entropy vs. path-entropy curves
2. Normalized MFPT/WHR vs. λ (log scale)
3. Rationality minima vs. λ (log scale)
All plots share a logarithmic x-axis (λ) and metric-based y-axes.
---
### Components/Axes
#### Common Elements
- **X-axis**: λ (log scale, 10⁻⁴ to 10⁴)
- **Y-axes**:
- Subplot 1: Expected metric values (0.0–1.4)
- Subplot 2: Normalized MFPT/WHR (0.0–1.0)
- Subplot 3: Rationality minima (0.0–1.0)
- **Legends**:
- Red solid: Cross-entropy (⟨E⟩_λ)
- Blue dashed: Path-entropy (⟨H⟩_λ)
- Black solid: MFPT (Mean First Passage Time)
- Red dashed: WHR (Wasserstein Heuristic Ratio)
- Blue shaded: Intuition region (subplot 2 only)
- Purple dashed: m_d = 0.7 threshold (subplot 3 only)
#### Spatial Grounding
- **Legend placement**: Upper-right corner of each subplot
- **Intuition shading**: Centered in subplot 2 (λ ≈ 10⁻¹ to 10¹)
- **Critical points insets**: Top-right corner of subplot 1
---
### Detailed Analysis
#### Subplot 1: Entropy Curves
- **β = 2.0 (A)**:
- Cross-entropy (red) rises sharply at λ ≈ 10⁻¹, plateauing at 1.35.
- Path-entropy (blue) remains flat until λ ≈ 10⁻², then increases to 1.25.
- Critical points: E peaks at λ ≈ 10⁻¹ (derivative ≈ 0.15), H peaks at λ ≈ 10⁻² (derivative ≈ 0.05).
- **β = 5.0 (B)**:
- Cross-entropy rises at λ ≈ 10⁻², reaching 1.3.
- Path-entropy increases at λ ≈ 10⁻³, peaking at 1.15.
- Critical points: E derivative ≈ 0.2, H derivative ≈ 0.1.
- **β = 20.0 (C)**:
- Cross-entropy rises abruptly at λ ≈ 10⁻¹, reaching 1.3.
- Path-entropy increases at λ ≈ 10⁻², peaking at 1.1.
- Critical points: E derivative ≈ 0.6, H derivative ≈ 0.3.
#### Subplot 2: MFPT/WHR
- **β = 2.0 (A)**:
- MFPT (black) drops from 1.0 to 0.2 at λ ≈ 10⁻¹.
- WHR (red) remains flat until λ ≈ 10⁻¹, then rises to 0.8.
- Intuition region (blue) spans λ ≈ 10⁻¹ to 10¹.
- **β = 5.0 (B)**:
- MFPT drops sharply at λ ≈ 10⁻², reaching 0.2.
- WHR rises at λ ≈ 10⁻², peaking at 0.6.
- Intuition region expands to λ ≈ 10⁻² to 10².
- **β = 20.0 (C)**:
- MFPT drops to 0.1 at λ ≈ 10⁻².
- WHR rises to 0.4 at λ ≈ 10⁻².
- Intuition region spans λ ≈ 10⁻² to 10³.
#### Subplot 3: Rationality Minima
- **β = 2.0 (A)**:
- Global minima (black) drops to 0.2 at λ ≈ 10⁻¹.
- Second minima (black dashed) remains at 0.6.
- m_d = 0.7 threshold (purple) is horizontal.
- **β = 5.0 (B)**:
- Global minima drops to 0.1 at λ ≈ 10⁻².
- Second minima (black dashed) appears at λ ≈ 10⁻¹.
- m_d = 0.7 threshold intersects second minima.
- **β = 20.0 (C)**:
- Global minima drops to 0.05 at λ ≈ 10⁻².
- Second/third minima (black dashed/dotted) are negligible.
- m_d = 0.7 threshold aligns with global minima.
---
### Key Observations
1. **Entropy Sensitivity**:
- Higher β_dream increases sensitivity to λ, with sharper entropy transitions.
- Critical point derivatives (E, H) scale with β_dream (e.g., β=20: E derivative ≈ 0.6 vs. β=2: 0.15).
2. **MFPT/WHR Dynamics**:
- MFPT decreases monotonically with λ, while WHR increases after a threshold.
- Intuition regions expand with β_dream, suggesting broader alignment between metrics and model behavior.
3. **Rationality Minima**:
- Global minima improve (lower values) with higher β_dream, especially at λ ≈ 10⁻².
- Second/third minima vanish at β=20, indicating a single dominant solution.
---
### Interpretation
- **β_dream Role**:
- Higher β_dream amplifies the impact of λ on entropy and metric values, reflecting stronger regularization or constraint enforcement.
- The intuition regions (blue shading) likely represent λ ranges where the model’s learned representations align optimally with the metric.
- **Practical Implications**:
- For β=20, the sharp drop in global minima (subplot 3) suggests λ ≈ 10⁻² is optimal for minimizing rationality loss.
- The disappearance of higher-order minima at β=20 implies a unique global solution dominates, reducing overfitting risks.
- **Anomalies**:
- In β=5 (B), the intuition region overlaps with the second minima in subplot 3, hinting at a trade-off between intuition and metric alignment.
- Cross-entropy plateaus at ~1.3 across all β values, indicating a saturation point in metric discrimination.