# Technical Document Extraction
## Crystal Structure Diagram
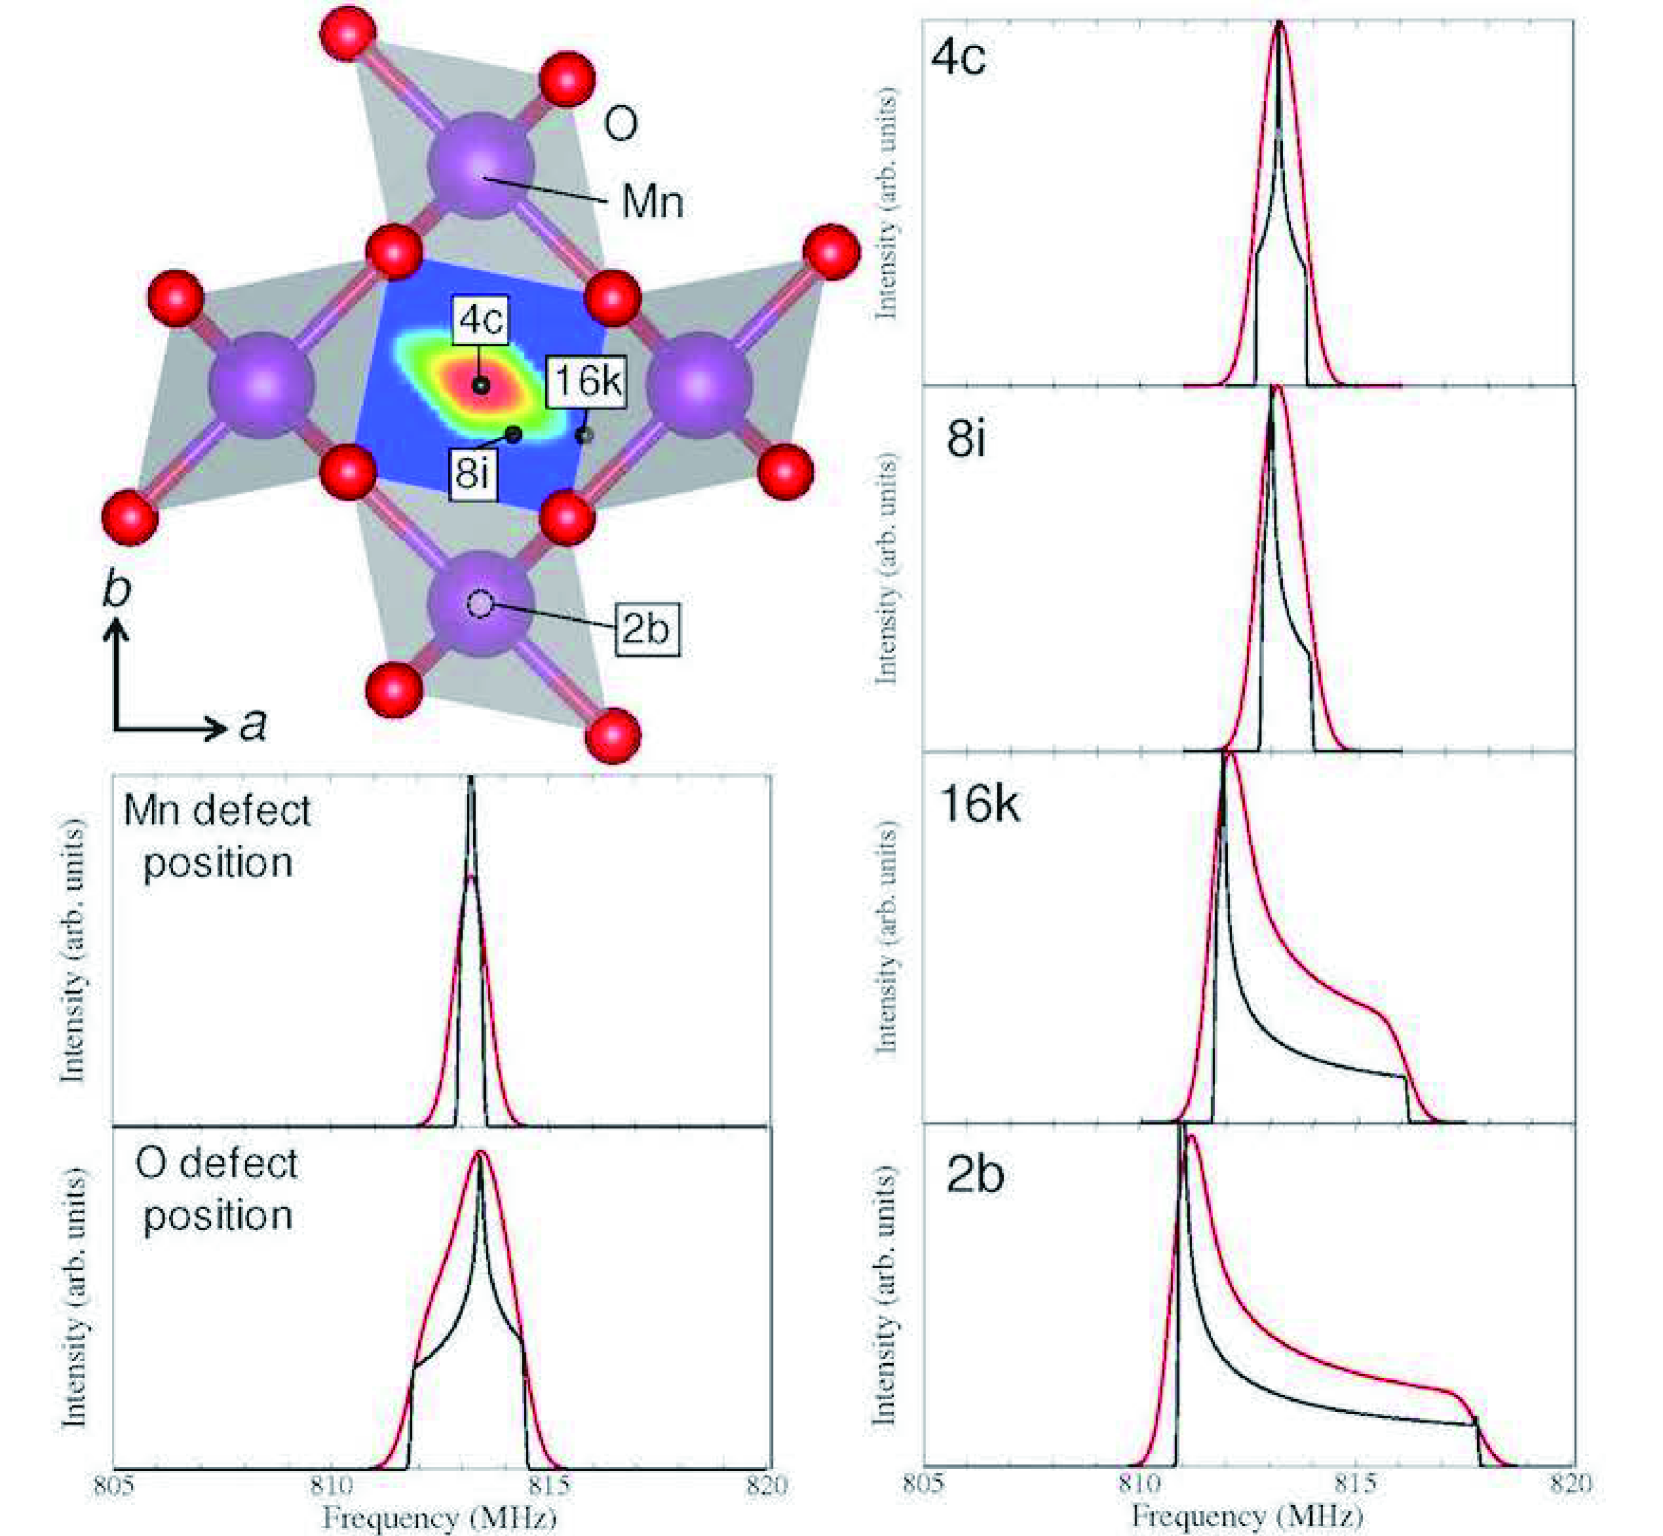
- **Components**:
- **Atoms**:
- Purple spheres labeled `Mn` (Manganese)
- Red spheres labeled `O` (Oxygen)
- **Lattice Positions**:
- `4c` (marked with a black dot in the central region)
- `8i` (marked with a black dot near the center)
- `16k` (marked with a black dot near the center)
- `2b` (marked with a black dot near the center)
- **Axes**:
- `a` (horizontal axis, labeled with an arrow)
- `b` (vertical axis, labeled with an arrow)
## Graphs (Intensity vs. Frequency)
### General Observations
- **X-axis**: Frequency (MHz), range: 805–820 MHz
- **Y-axis**: Intensity (arbitrary units)
- **Lines**:
- **Red**: Labeled as "Mn defect position" (lower graphs) and "O defect position" (upper graphs)
- **Black**: Labeled as "O defect position" (lower graphs) and "Mn defect position" (upper graphs)
### Graph Details
1. **Graph 1: `4c` Position**
- **Title**: `4c`
- **Lines**:
- Red: Sharp peak at ~812 MHz
- Black: Sharp peak at ~812 MHz (slightly broader)
2. **Graph 2: `8i` Position**
- **Title**: `8i`
- **Lines**:
- Red: Sharp peak at ~812 MHz
- Black: Sharp peak at ~812 MHz (slightly broader)
3. **Graph 3: `16k` Position**
- **Title**: `16k`
- **Lines**:
- Red: Sharp peak at ~812 MHz
- Black: Sharp peak at ~812 MHz (slightly broader)
4. **Graph 4: `2b` Position**
- **Title**: `2b`
- **Lines**:
- Red: Broad peak centered at ~812 MHz
- Black: Broad peak centered at ~812 MHz (narrower)
### Mn Defect Position Graph
- **Title**: `Mn defect position`
- **Lines**:
- Red: Sharp peak at ~812 MHz
- Black: Sharp peak at ~812 MHz (slightly broader)
### O Defect Position Graph
- **Title**: `O defect position`
- **Lines**:
- Red: Sharp peak at ~812 MHz
- Black: Sharp peak at ~812 MHz (slightly broader)
## Key Trends
- All graphs show peaks centered around **812 MHz**.
- Red lines (Mn/O defect positions) generally exhibit sharper peaks compared to black lines.
- The `2b` position graphs show broader peaks compared to other positions.