## Line Graph: Average Incorrect Flips Over Iterations
### Overview
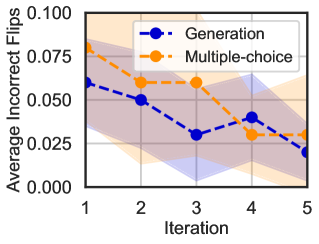
The image is a line graph comparing two methods ("Generation" and "Multiple-choice") across five iterations, measuring "Average Incorrect Flips" on a y-axis (0.000–0.100) and "Iteration" on the x-axis (1–5). Shaded regions around the lines represent confidence intervals.
### Components/Axes
- **X-axis (Iteration)**: Labeled "Iteration," with ticks at 1, 2, 3, 4, 5.
- **Y-axis (Average Incorrect Flips)**: Labeled "Average Incorrect Flips," with ticks at 0.000, 0.025, 0.050, 0.075, 0.100.
- **Legend**: Located in the top-right corner, with:
- **Blue dashed line**: "Generation"
- **Orange dashed line**: "Multiple-choice"
- **Shaded Regions**: Light blue (Generation) and light orange (Multiple-choice) indicate uncertainty intervals.
### Detailed Analysis
#### Generation (Blue Dashed Line)
- **Iteration 1**: ~0.06
- **Iteration 2**: ~0.05
- **Iteration 3**: ~0.03
- **Iteration 4**: ~0.04
- **Iteration 5**: ~0.02
- **Trend**: Decreasing overall, with a slight uptick in Iteration 4 before resuming decline.
#### Multiple-choice (Orange Dashed Line)
- **Iteration 1**: ~0.08
- **Iteration 2**: ~0.06
- **Iteration 3**: ~0.06
- **Iteration 4**: ~0.03
- **Iteration 5**: ~0.03
- **Trend**: Steady decline until Iteration 4, then plateaus.
#### Shaded Regions
- **Generation**: Confidence intervals widen in Iterations 1–2, narrow in Iterations 3–5.
- **Multiple-choice**: Confidence intervals remain relatively consistent across iterations.
### Key Observations
1. Both methods show improvement in reducing incorrect flips over iterations.
2. "Multiple-choice" starts with higher error rates but declines more consistently.
3. "Generation" exhibits variability, with a temporary increase in Iteration 4.
4. Shaded regions suggest greater uncertainty in early iterations for both methods.
### Interpretation
The data suggests that both "Generation" and "Multiple-choice" methods improve performance (reduce incorrect flips) as iterations increase. However, "Multiple-choice" demonstrates more stability, while "Generation" shows fluctuating performance, particularly in Iteration 4. The shaded confidence intervals highlight that results are less reliable in early iterations, emphasizing the need for larger sample sizes or extended testing to validate trends. The plateau in "Multiple-choice" at Iteration 5 may indicate diminishing returns or convergence toward an optimal threshold.