\n
## Line Chart: Average Incorrect Flips vs. Iteration
### Overview
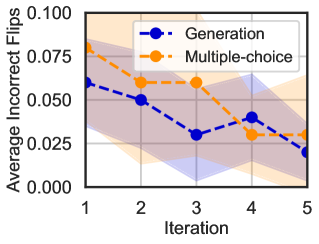
This image presents a line chart comparing the average number of incorrect flips over five iterations for two methods: "Generation" and "Multiple-choice". The chart also includes shaded regions representing the variance or confidence intervals around each line.
### Components/Axes
* **X-axis:** Iteration, ranging from 1 to 5.
* **Y-axis:** Average Incorrect Flips, ranging from 0.000 to 0.100.
* **Data Series 1:** "Generation" - Represented by a dashed blue line with circular markers.
* **Data Series 2:** "Multiple-choice" - Represented by a dashed orange line with circular markers.
* **Legend:** Located in the top-right corner, associating colors with the methods.
* **Shaded Regions:** Light purple and orange shading around each line, indicating variance.
### Detailed Analysis
**Generation (Blue Line):**
The blue line representing "Generation" generally slopes downward from Iteration 1 to Iteration 5, indicating a decrease in average incorrect flips over time.
* Iteration 1: Approximately 0.062
* Iteration 2: Approximately 0.052
* Iteration 3: Approximately 0.038
* Iteration 4: Approximately 0.028
* Iteration 5: Approximately 0.035
**Multiple-choice (Orange Line):**
The orange line representing "Multiple-choice" shows a more fluctuating trend. It starts high at Iteration 1, decreases to Iteration 4, and then increases again at Iteration 5.
* Iteration 1: Approximately 0.082
* Iteration 2: Approximately 0.072
* Iteration 3: Approximately 0.062
* Iteration 4: Approximately 0.025
* Iteration 5: Approximately 0.038
**Shaded Regions:**
The shaded regions around each line indicate the variability of the data. The purple shading around the blue line is relatively narrow, suggesting less variance in the "Generation" method. The orange shading around the orange line is wider, indicating more variance in the "Multiple-choice" method.
### Key Observations
* The "Generation" method consistently exhibits fewer incorrect flips than the "Multiple-choice" method across all iterations.
* The "Generation" method shows a clear decreasing trend in incorrect flips, suggesting improvement with each iteration.
* The "Multiple-choice" method is more volatile, with a decrease followed by an increase in incorrect flips.
* The variance in the "Multiple-choice" method is higher than in the "Generation" method.
### Interpretation
The data suggests that the "Generation" method is more stable and effective at reducing incorrect flips over iterations compared to the "Multiple-choice" method. The decreasing trend in the "Generation" method indicates that it learns and improves with each iteration. The higher variance in the "Multiple-choice" method suggests that its performance is more sensitive to the specific input or conditions. The initial higher error rate of the "Multiple-choice" method, combined with its increased variance, suggests it may be less reliable or require more iterations to converge to a stable solution. The increase in incorrect flips at Iteration 5 for the "Multiple-choice" method is an anomaly that warrants further investigation. It could be due to a change in the input data, a bug in the algorithm, or simply random variation.