## Line Chart: Average Incorrect Flips Over Iterations
### Overview
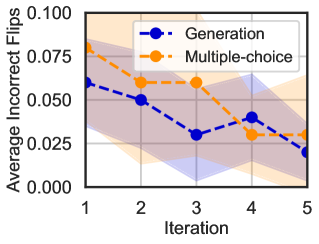
The image is a line chart comparing the performance of two methods, "Generation" and "Multiple-choice," across five iterations. The performance metric is the "Average Incorrect Flips," where a lower value indicates better performance. The chart includes shaded regions around each line, likely representing confidence intervals or variability.
### Components/Axes
* **Chart Type:** Line chart with two data series and shaded error bands.
* **X-Axis:**
* **Label:** "Iteration"
* **Scale:** Discrete, linear scale from 1 to 5.
* **Markers:** Ticks at integers 1, 2, 3, 4, 5.
* **Y-Axis:**
* **Label:** "Average Incorrect Flips"
* **Scale:** Linear scale from 0.000 to 0.100.
* **Markers:** Ticks at 0.000, 0.025, 0.050, 0.075, 0.100.
* **Legend:**
* **Position:** Top-right corner of the plot area.
* **Series 1:** "Generation" - Represented by a blue dashed line with circular markers.
* **Series 2:** "Multiple-choice" - Represented by an orange dashed line with circular markers.
* **Data Series & Shading:**
* The "Generation" series has a blue shaded area around its line.
* The "Multiple-choice" series has an orange shaded area around its line.
* The shaded areas overlap significantly, particularly in later iterations.
### Detailed Analysis
**Trend Verification:**
* **Generation (Blue Line):** The line shows an overall downward trend from iteration 1 to 5, with a notable dip at iteration 3 and a slight rise at iteration 4 before falling again.
* **Multiple-choice (Orange Line):** The line shows a general downward trend, with a plateau between iterations 2 and 3, followed by a steeper decline.
**Data Point Extraction (Approximate Values):**
| Iteration | Generation (Avg. Incorrect Flips) | Multiple-choice (Avg. Incorrect Flips) |
| :--- | :--- | :--- |
| 1 | ~0.060 | ~0.080 |
| 2 | ~0.050 | ~0.060 |
| 3 | ~0.030 | ~0.060 |
| 4 | ~0.040 | ~0.030 |
| 5 | ~0.020 | ~0.030 |
**Shaded Region Analysis:**
* The shaded regions (likely confidence intervals) are widest at iteration 1 for both series, suggesting higher initial variability.
* The bands narrow considerably by iteration 5, indicating more consistent results as iterations progress.
* The blue and orange shaded areas overlap substantially from iteration 2 onward, suggesting the performance difference between the two methods may not be statistically significant at many points.
### Key Observations
1. **Initial Performance Gap:** At iteration 1, the "Multiple-choice" method has a higher average error (~0.080) compared to the "Generation" method (~0.060).
2. **Convergence:** By iteration 5, the performance of both methods converges to a similar low error rate (between ~0.020 and ~0.030).
3. **Non-Monotonic Improvement:** The "Generation" method does not improve linearly; its error rate increases slightly from iteration 3 to 4 before decreasing again.
4. **Plateau in Multiple-choice:** The "Multiple-choice" method shows no improvement between iterations 2 and 3, maintaining an error rate of ~0.060.
5. **Reducing Variability:** The narrowing of the shaded bands for both series indicates that the results become more precise and less variable with more iterations.
### Interpretation
The chart demonstrates that both the "Generation" and "Multiple-choice" methods are effective at reducing the "Average Incorrect Flips" over successive iterations, suggesting a learning or optimization process.
* **Relative Efficacy:** The "Generation" method starts with a performance advantage. However, the "Multiple-choice" method shows a steeper rate of improvement between iterations 3 and 5, ultimately catching up.
* **Convergence and Reliability:** The convergence of the lines and the narrowing of the confidence bands by iteration 5 suggest that given enough iterations, both methods achieve a similar, reliable, and low-error outcome. The initial higher variability diminishes, indicating the process stabilizes.
* **Practical Implication:** If the goal is to minimize errors quickly (in few iterations), the "Generation" method appears superior initially. If the process can run for more iterations (5 or more), the choice between methods may become less critical based on this final error metric alone. The overlapping confidence intervals caution against declaring one method definitively better than the other at most individual iteration points without further statistical analysis. The data suggests the underlying process for both methods becomes more consistent and accurate over time.