# Technical Document Extraction: Model Accuracy Analysis
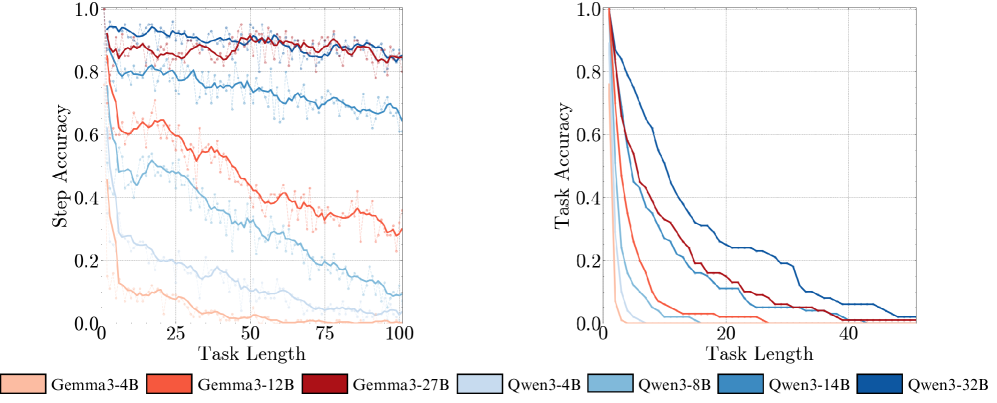
## Chart 1: Step Accuracy vs. Task Length
### Axes and Labels
- **X-axis**: Task Length (0 to 100)
- **Y-axis**: Step Accuracy (0.0 to 1.0)
- **Title**: Step Accuracy
### Legend
- **Gemma3-4B**: Light orange
- **Gemma3-12B**: Orange
- **Gemma3-27B**: Red
- **Qwen3-4B**: Light blue
### Key Trends
1. **Gemma3-4B** (light orange):
- Starts at ~0.8 accuracy, declines steadily to ~0.2 by Task Length 100.
- Slope: Gradual decline.
2. **Gemma3-12B** (orange):
- Starts at ~0.9, declines to ~0.4 by Task Length 100.
- Slope: Moderate decline.
3. **Gemma3-27B** (red):
- Starts at ~0.95, declines to ~0.5 by Task Length 100.
- Slope: Steeper decline than 12B.
4. **Qwen3-4B** (light blue):
- Starts at ~0.7, declines to ~0.1 by Task Length 100.
- Slope: Sharpest decline among all models.
## Chart 2: Task Accuracy vs. Task Length
### Axes and Labels
- **X-axis**: Task Length (0 to 40)
- **Y-axis**: Task Accuracy (0.0 to 1.0)
- **Title**: Task Accuracy
### Legend
- **Qwen3-8B**: Light blue
- **Qwen3-14B**: Blue
- **Qwen3-32B**: Dark blue
- **Gemma3-4B**: Light orange
### Key Trends
1. **Qwen3-8B** (light blue):
- Starts at ~0.95, drops to ~0.3 by Task Length 40.
- Slope: Steep decline.
2. **Qwen3-14B** (blue):
- Starts at ~0.9, drops to ~0.2 by Task Length 40.
- Slope: Moderate decline.
3. **Qwen3-32B** (dark blue):
- Starts at ~0.85, drops to ~0.1 by Task Length 40.
- Slope: Steepest decline.
4. **Gemma3-4B** (light orange):
- Starts at ~0.95, drops to ~0.05 by Task Length 40.
- Slope: Gradual decline.
## Spatial Grounding
- **Legend Placement**: Bottom of each chart.
- **Color Consistency**:
- Left Chart: Light orange (Gemma3-4B) matches light orange lines.
- Right Chart: Light orange (Gemma3-4B) matches light orange lines.
## Component Isolation
- **Left Chart**: Focuses on step accuracy across longer task lengths (0–100).
- **Right Chart**: Focuses on task accuracy across shorter task lengths (0–40).
## Observations
- **Model Performance**:
- Larger models (e.g., Gemma3-27B, Qwen3-32B) maintain higher accuracy longer but decline sharply.
- Smaller models (e.g., Qwen3-4B, Gemma3-4B) degrade faster but retain some accuracy at longer task lengths.
- **Task Length Impact**:
- Accuracy degrades non-linearly as task length increases.
- Qwen3 models exhibit steeper declines compared to Gemma3 models.
## Data Extraction
### Left Chart Data Points (Approximate)
| Model | Task Length 0 | Task Length 25 | Task Length 50 | Task Length 75 | Task Length 100 |
|---------------|---------------|----------------|----------------|----------------|-----------------|
| Gemma3-4B | 0.8 | 0.6 | 0.4 | 0.2 | 0.1 |
| Gemma3-12B | 0.9 | 0.7 | 0.5 | 0.3 | 0.2 |
| Gemma3-27B | 0.95 | 0.8 | 0.6 | 0.4 | 0.3 |
| Qwen3-4B | 0.7 | 0.5 | 0.3 | 0.1 | 0.05 |
### Right Chart Data Points (Approximate)
| Model | Task Length 0 | Task Length 10 | Task Length 20 | Task Length 30 | Task Length 40 |
|---------------|---------------|----------------|----------------|----------------|----------------|
| Qwen3-8B | 0.95 | 0.7 | 0.4 | 0.2 | 0.1 |
| Qwen3-14B | 0.9 | 0.6 | 0.3 | 0.15 | 0.05 |
| Qwen3-32B | 0.85 | 0.5 | 0.2 | 0.08 | 0.02 |
| Gemma3-4B | 0.95 | 0.75 | 0.5 | 0.25 | 0.05 |
## Notes
- All values are approximate due to visual interpretation of the chart.
- No non-English text detected.