## Candlestick Chart: Bitcoin/Dollar Price Over Time
### Overview
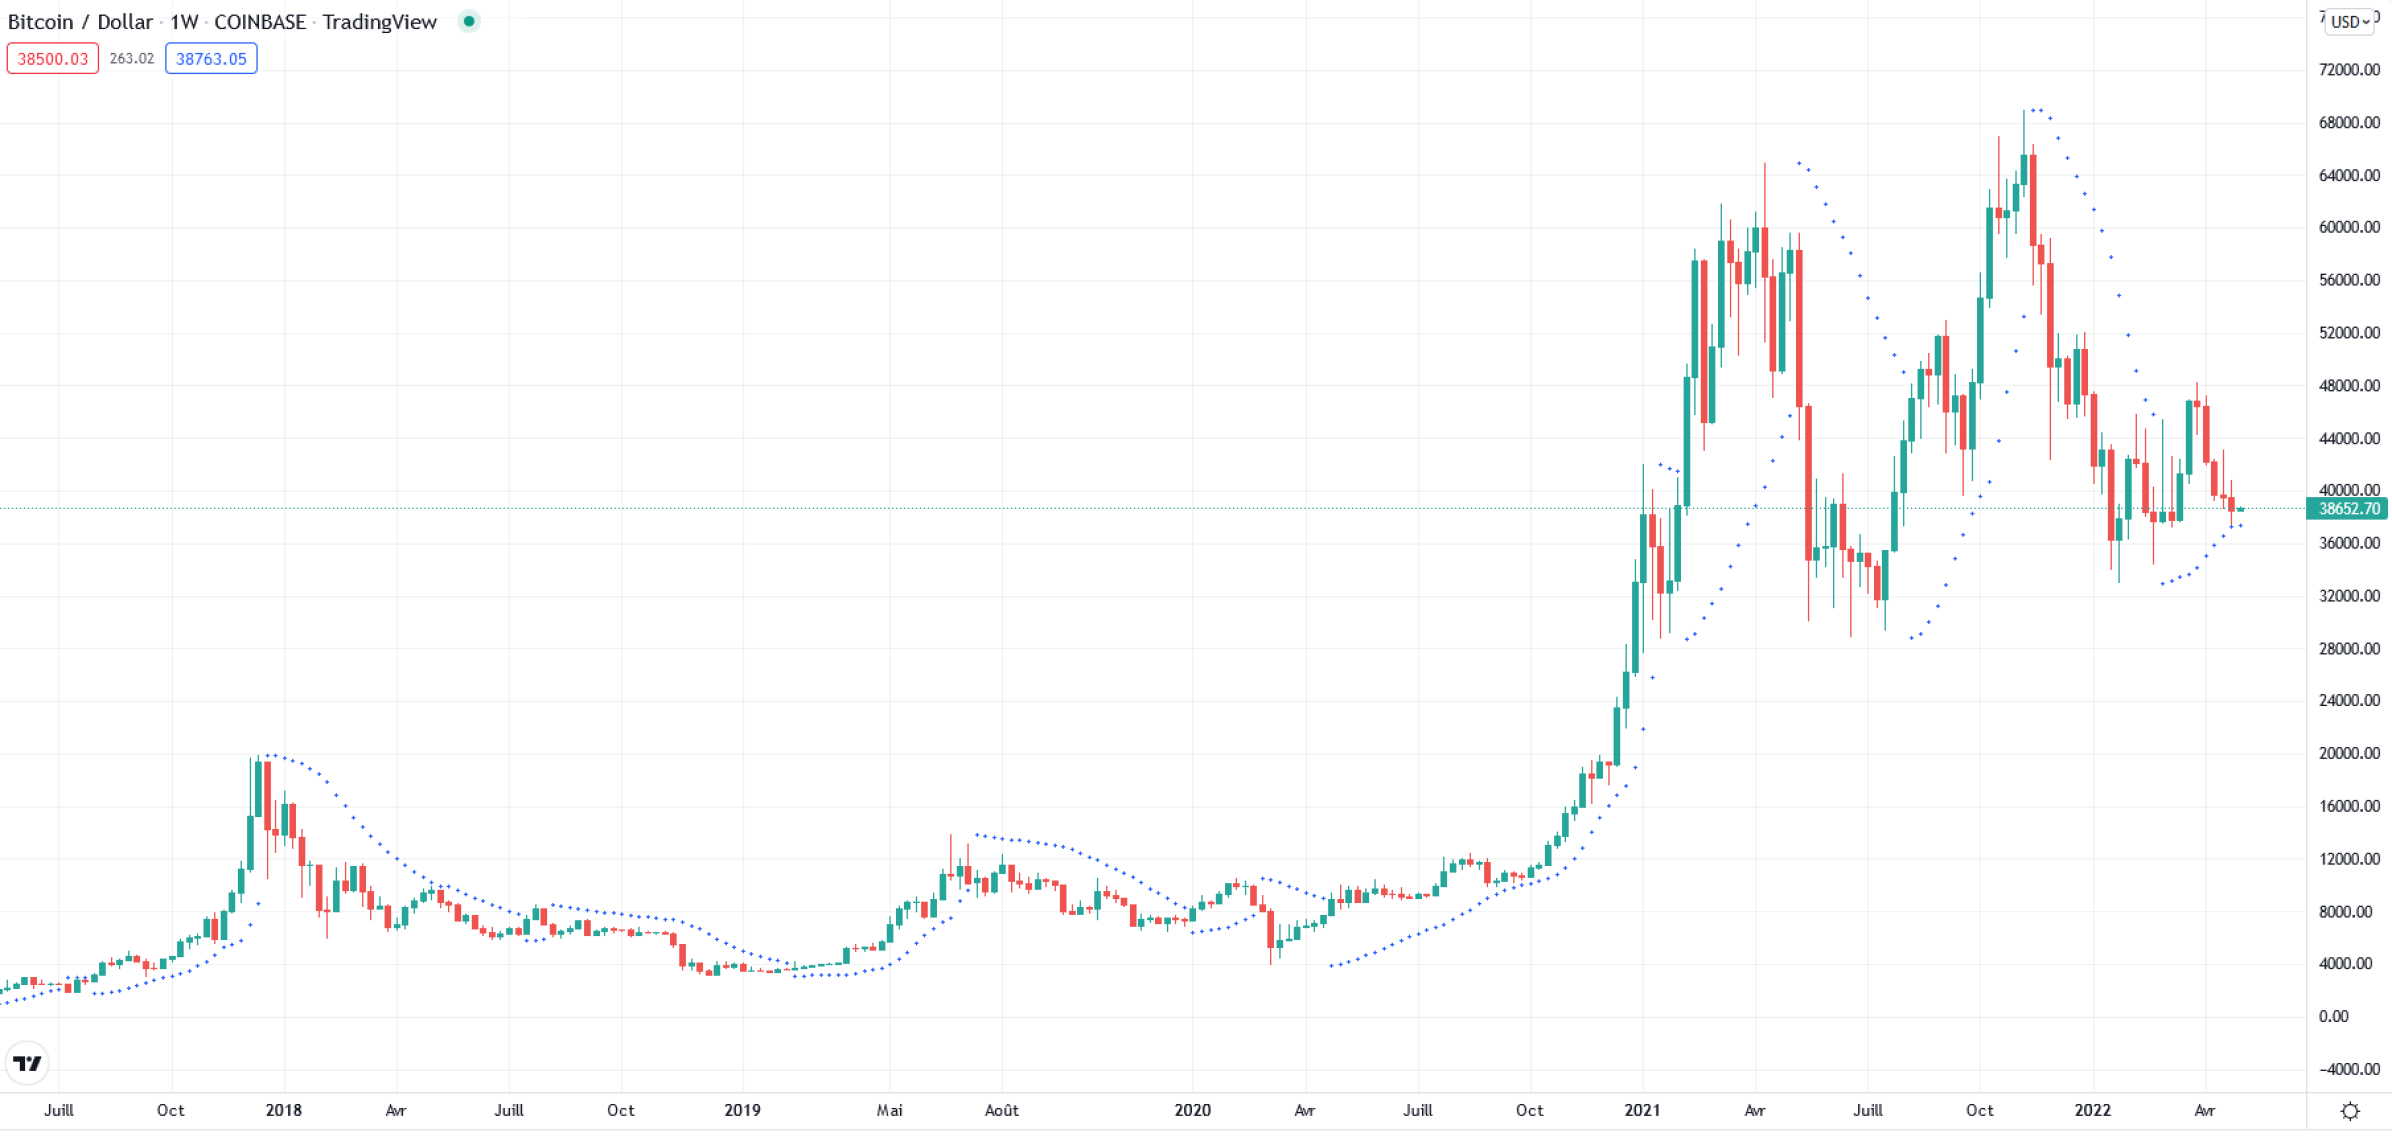
The image is a candlestick chart showing the price of Bitcoin against the US Dollar (Bitcoin/Dollar) over time. The chart spans from approximately July 2017 to April 2023, with weekly (1W) intervals. The data source is COINBASE, and the chart is generated using TradingView. The chart displays the open, high, low, and close prices for each week using candlestick representations, with green candles indicating a price increase and red candles indicating a price decrease. A blue dotted line surrounds the price action.
### Components/Axes
* **Title:** Bitcoin / Dollar 1W COINBASE TradingView
* **X-axis:** Time, labeled with months (Juill, Oct, Avr, Mai, Août) and years (2018, 2019, 2020, 2021, 2022).
* **Y-axis:** Price in USD, ranging from -4000.00 to 72000.00, with increments of 4000.00.
* **Candlesticks:** Green candles represent price increases, and red candles represent price decreases.
* **Price Indicators:** 38500.03, 263.02, 38763.05 (likely represent current price, low, and high values, respectively).
* **Current Price:** 38652.70
### Detailed Analysis
* **Overall Trend:** The price of Bitcoin shows significant volatility over the period.
* **2017-2020:** From July 2017 to early 2020, the price fluctuates, generally staying below 16000.00 USD. There are periods of increase and decrease, but no sustained upward trend.
* **2020-2021:** Starting in late 2020, the price begins a significant upward trend, reaching a peak around late 2021.
* **2021-2022:** After the peak in late 2021, the price declines sharply throughout 2022.
* **2022-2023:** From late 2022 into early 2023, the price shows some recovery but remains significantly below its peak.
**Specific Data Points (Approximate):**
* **Late 2017:** Price around 4000.00 USD.
* **Early 2018:** Peak around 16000.00 USD.
* **Late 2018:** Low around 4000.00 USD.
* **Early 2020:** Price around 8000.00 USD.
* **Late 2020:** Price starts to increase significantly from around 12000.00 USD.
* **April 2021:** Price around 60000.00 USD.
* **Late 2021:** Peak around 68000.00 USD.
* **Mid 2022:** Price drops to around 20000.00 USD.
* **April 2023:** Price around 38652.70 USD.
### Key Observations
* **Volatility:** The Bitcoin price is highly volatile, with large swings in both directions.
* **Bull Run:** The period from late 2020 to late 2021 represents a significant bull run.
* **Bear Market:** The period throughout 2022 represents a significant bear market.
* **Recovery:** There is a slight recovery in price in early 2023, but it is not as significant as the previous bull run.
### Interpretation
The chart illustrates the speculative nature of Bitcoin as an asset. The dramatic price increase in 2020-2021, followed by a sharp decline in 2022, highlights the risks associated with investing in cryptocurrencies. The chart suggests that Bitcoin is subject to market sentiment and external factors, leading to periods of rapid growth and decline. The blue dotted line surrounding the price action may represent Bollinger Bands, which are used to measure the volatility of an asset.