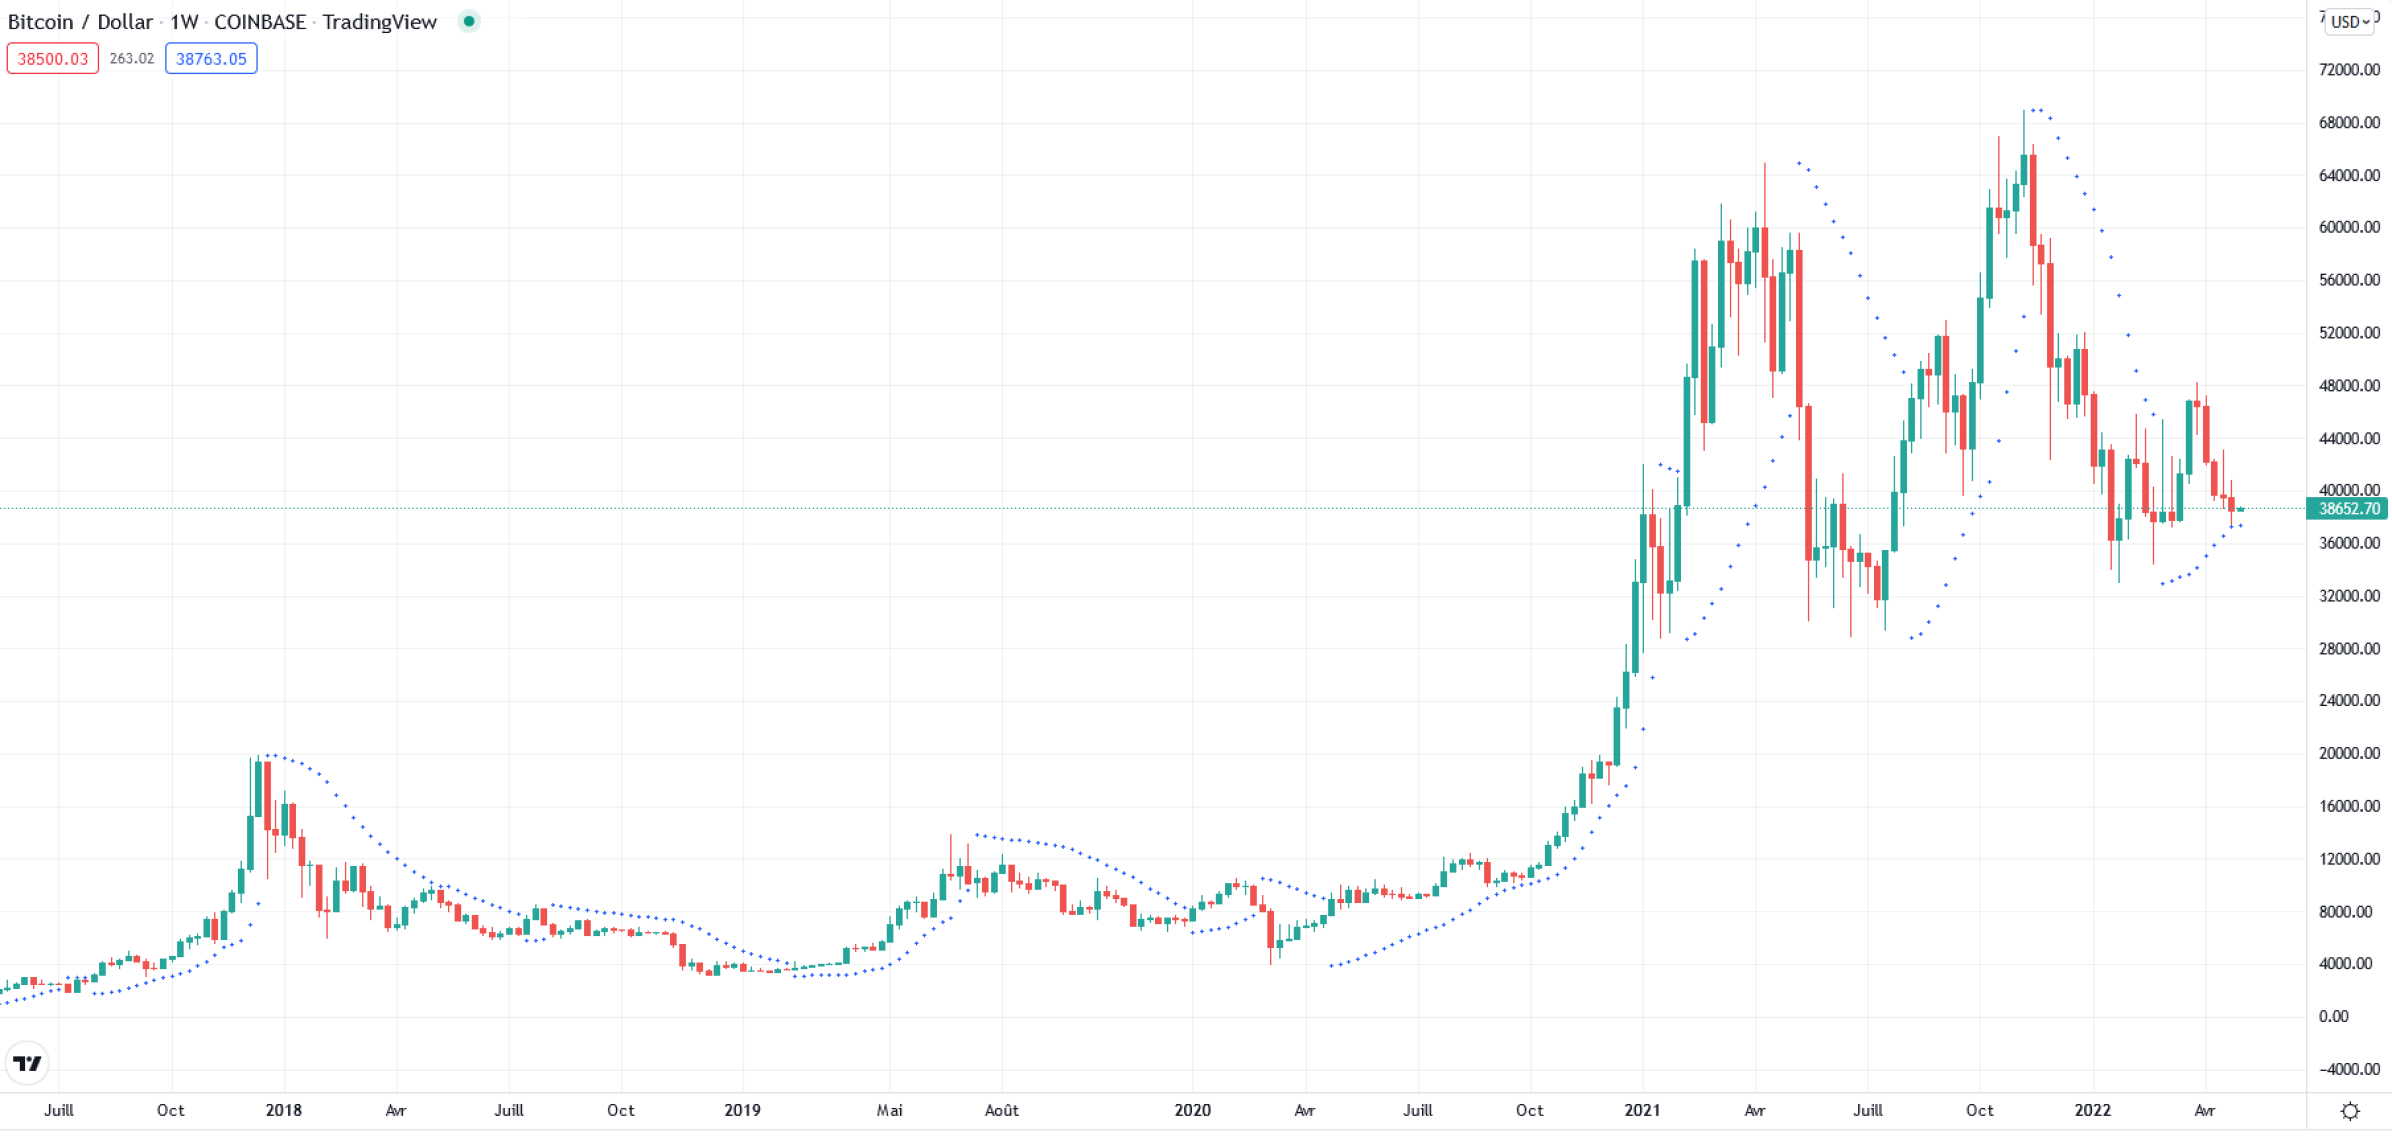
## Line Chart: Bitcoin / Dollar (1W) - COINBASE TradingView
### Overview
The chart displays Bitcoin's price fluctuations against the US Dollar over a 5-year period (July 2017–April 2023). It features two primary data series (green upward trends, red downward trends) and a blue dotted trendline. The current price (April 2023) is highlighted in green at $38,652.70.
### Components/Axes
- **X-Axis (Time)**:
- Labeled with monthly intervals (e.g., "Juill" = July, "Oct" = October).
- Covers July 2017 to April 2023.
- **Y-Axis (Price in USD)**:
- Range: -$4,000 to $72,000.
- Increment: $4,000 per major tick.
- **Legend**:
- Green: Upward price movement.
- Red: Downward price movement.
- **Title**: "Bitcoin / Dollar - 1W · COINBASE · TradingView" (top-left).
- **Current Price Marker**: Green dot at $38,652.70 (bottom-right).
### Detailed Analysis
1. **Price Trends**:
- **July 2017**: Starts at ~$38,500 (red marker).
- **October 2017**: Sharp rise to ~$63,000 (green marker).
- **April 2018**: Sharp decline to ~$3,800 (red marker).
- **July 2018–April 2019**: Sideways consolidation (~$3,800–$10,000).
- **May 2020**: Surge to ~$60,000 (green marker).
- **July 2021**: Peaks at ~$72,000 (green marker).
- **October 2021–April 2022**: Sharp drop to ~$16,000 (red marker).
- **July 2022–April 2023**: Recovery to ~$38,652.70 (green marker).
2. **Trendline**:
- Blue dotted line tracks overall price direction.
- Shows cyclical volatility with alternating bull (green) and bear (red) markets.
3. **Key Data Points**:
- **Highest Peak**: ~$72,000 (July 2021).
- **Lowest Trough**: ~$3,800 (April 2018).
- **Current Price**: $38,652.70 (April 2023).
### Key Observations
- **Volatility**: Extreme price swings (e.g., 2017–2018 crash, 2021 peak).
- **Cyclical Patterns**: Repeated bull/bear cycles with diminishing amplitude post-2021.
- **Current Position**: Price near 2017 starting level but with higher volatility.
### Interpretation
The chart reflects Bitcoin's speculative nature, driven by macroeconomic factors (e.g., inflation, regulatory news) and market sentiment. The 2021 peak aligns with institutional adoption and ETF approvals, while the 2022 crash correlates with interest rate hikes. The current price suggests cautious optimism but remains below the 2021 high, indicating unresolved market uncertainty. The blue trendline underscores the long-term upward trajectory despite short-term fluctuations.