TECHNICAL ASSET FINGERPRINT
05f39442d86514178fe81d10
Click to view fullscreen
Press ESC or click to close
FOUND IN PAPERS
EXPERT: healer-alpha-free VERSION 1
RUNTIME: free/openrouter/healer-alpha
INTEL_VERIFIED
## Line Charts: I-Don't-Know Rate Across Model Layers
### Overview
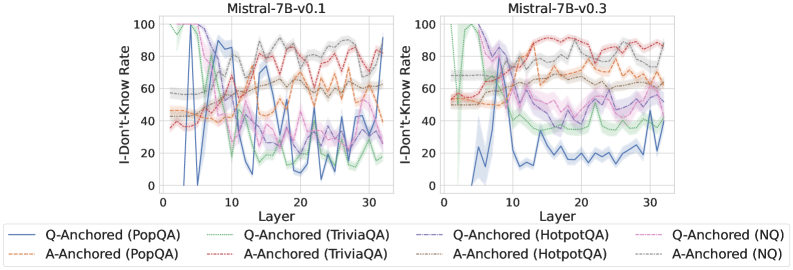
The image displays two side-by-side line charts comparing the "I-Don't-Know Rate" across the layers (0-30) of two versions of the Mistral-7B language model: v0.1 (left) and v0.3 (right). Each chart plots eight data series, representing two different prompting methods ("Q-Anchored" and "A-Anchored") applied to four distinct question-answering datasets (PopQA, TriviaQA, HotpotQA, NQ). The charts illustrate how the model's expressed uncertainty (its rate of producing an "I don't know" response) changes as information propagates through its internal layers.
### Components/Axes
* **Chart Titles:** "Mistral-7B-v0.1" (left chart), "Mistral-7B-v0.3" (right chart).
* **Y-Axis (Both Charts):** Label: "I-Don't-Know Rate". Scale: 0 to 100, with major tick marks at intervals of 20 (0, 20, 40, 60, 80, 100).
* **X-Axis (Both Charts):** Label: "Layer". Scale: 0 to 30, with major tick marks at intervals of 10 (0, 10, 20, 30).
* **Legend (Bottom Center, spanning both charts):** Contains eight entries, each with a unique line color and style.
* **Q-Anchored Series (Solid Lines):**
* `Q-Anchored (PopQA)`: Solid blue line.
* `Q-Anchored (TriviaQA)`: Solid green line.
* `Q-Anchored (HotpotQA)`: Solid purple line.
* `Q-Anchored (NQ)`: Solid pink/red line.
* **A-Anchored Series (Dashed Lines):**
* `A-Anchored (PopQA)`: Dashed orange line.
* `A-Anchored (TriviaQA)`: Dashed red line.
* `A-Anchored (HotpotQA)`: Dashed gray line.
* `A-Anchored (NQ)`: Dashed brown line.
* **Grid:** Light gray grid lines are present in the background of both charts.
### Detailed Analysis
**Mistral-7B-v0.1 (Left Chart):**
* **General Trend:** All series show high variability and fluctuation across layers. There is no single, smooth monotonic trend for any series.
* **Q-Anchored Series (Solid Lines):** These lines generally start at a high rate (between ~60-100) in the early layers (0-5). They exhibit a sharp dip or valley between layers 5-10, often dropping below 40. After layer 10, they enter a phase of high-amplitude oscillation, with values swinging between approximately 10 and 90 through layer 30. The blue line (PopQA) and green line (TriviaQA) show particularly deep troughs near layer 10.
* **A-Anchored Series (Dashed Lines):** These lines start at a moderate level (between ~40-60) in the early layers. They show a more gradual, undulating pattern compared to the Q-Anchored lines. They generally rise to a peak between layers 15-25, with values often reaching 70-90, before showing a slight decline or stabilization towards layer 30. The dashed lines are generally less volatile than the solid lines in the later layers (20-30).
**Mistral-7B-v0.3 (Right Chart):**
* **General Trend:** The patterns are distinctly different from v0.1, showing more separation between the two method types (Q-Anchored vs. A-Anchored).
* **Q-Anchored Series (Solid Lines):** These lines start very high (near 100) in the earliest layers (0-3). They then experience a dramatic and sustained decline. The blue line (PopQA) plummets to near 0 by layer 10 and remains very low (mostly below 20) for the rest of the layers. The other solid lines (green, purple, pink) also decline significantly but stabilize at a higher plateau, fluctuating roughly between 20 and 50 from layer 10 to 30.
* **A-Anchored Series (Dashed Lines):** These lines start at a moderate level (~50-70) and show a general upward trend, peaking in the middle-to-late layers (15-25). They maintain high values (mostly between 60 and 90) throughout the second half of the network, showing less decline than their v0.1 counterparts. They are consistently higher than the Q-Anchored lines after approximately layer 8.
### Key Observations
1. **Version Comparison:** The most striking difference is the behavior of the Q-Anchored (solid) lines. In v0.3, they show a strong, sustained decrease in "I-Don't-Know Rate" after the initial layers, which is not present in v0.1. This is especially extreme for the PopQA dataset.
2. **Method Divergence:** In v0.3, a clear gap opens up between the two methods after layer ~8. The A-Anchored method maintains a high uncertainty rate, while the Q-Anchored method's uncertainty drops significantly. This separation is much less pronounced in v0.1.
3. **Dataset Sensitivity:** The PopQA dataset (blue/orange lines) shows the most extreme behavior in both charts, particularly the near-zero rate for Q-Anchored in v0.3. The other three datasets (TriviaQA, HotpotQA, NQ) follow more similar, grouped patterns within each method.
4. **Early Layer Behavior:** Both model versions show very high uncertainty (near 100) for Q-Anchored methods in the first few layers, suggesting the model initially lacks confidence regardless of version.
### Interpretation
The data suggests a significant evolution in the internal processing of the Mistral-7B model between versions v0.1 and v0.3, specifically regarding how it handles uncertainty when prompted with different formats.
* **Model Maturation:** The dramatic drop in "I-Don't-Know Rate" for Q-Anchored prompts in v0.3's deeper layers indicates that the updated model has become much more confident in its internal representations when the question is directly anchored. It appears to resolve uncertainty earlier in its processing stream (by layer 10) for this prompting style.
* **Anchoring Method Impact:** The persistent high uncertainty for A-Anchored prompts in v0.3 suggests that anchoring the answer format may prevent the model from consolidating confidence in the same way. The model seems to retain a higher degree of expressed uncertainty throughout its layers when the answer is pre-specified.
* **Dataset Characteristics:** The outlier behavior of PopQA, especially in v0.3, implies that the nature of the questions or answers in this dataset interacts uniquely with the model's knowledge and the anchoring mechanism, leading to near-complete elimination of "I don't know" responses for Q-Anchored prompts in later layers.
* **Architectural Insight:** The charts provide a window into the "confidence calibration" across the model's depth. The transition from high early-layer uncertainty to lower later-layer uncertainty (for Q-Anchored in v0.3) mirrors the expected flow of information processing, where raw inputs are transformed into more confident internal states. The lack of this trend in v0.1 suggests a less refined internal confidence mechanism.
**Language:** All text in the image is in English.
DECODING INTELLIGENCE...