## Line Chart: I-Don't-Know Rate Across Layers for Mistral-7B Models (v0.1 and v0.3)
### Overview
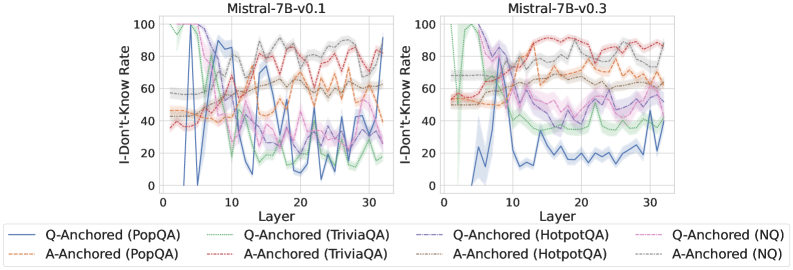
The image contains two line charts comparing the "I-Don't-Know Rate" (y-axis) across 30 layers (x-axis) for different question-answering models and anchoring methods in two versions of Mistral-7B (v0.1 and v0.3). Each chart includes multiple data series with distinct line styles and colors, representing combinations of anchoring types (Q-Anchored/A-Anchored) and datasets (PopQA, TriviaQA, HotpotQA, NQ). Confidence intervals are visualized as shaded regions around the lines.
---
### Components/Axes
- **X-Axis**: Layer (0–30, integer increments)
- **Y-Axis**: I-Don't-Know Rate (0–100%, integer increments)
- **Legends**:
- **Left Chart (v0.1)**:
- Q-Anchored (PopQA): Solid blue
- A-Anchored (PopQA): Dashed orange
- Q-Anchored (TriviaQA): Dotted green
- A-Anchored (TriviaQA): Dash-dot red
- Q-Anchored (HotpotQA): Solid purple
- A-Anchored (HotpotQA): Dashed gray
- **Right Chart (v0.3)**:
- Q-Anchored (PopQA): Solid blue
- A-Anchored (PopQA): Dashed orange
- Q-Anchored (TriviaQA): Dotted green
- A-Anchored (TriviaQA): Dash-dot red
- Q-Anchored (HotpotQA): Solid purple
- A-Anchored (HotpotQA): Dashed gray
- Q-Anchored (NQ): Dotted pink
- A-Anchored (NQ): Dash-dot gray
---
### Detailed Analysis
#### Left Chart (Mistral-7B-v0.1)
- **Q-Anchored (PopQA)** (blue solid): Peaks at ~90% at layer 5, drops to ~40% at layer 15, then fluctuates between 50–70%.
- **A-Anchored (PopQA)** (orange dashed): Stable between 40–60%, with minor dips at layers 10 and 25.
- **Q-Anchored (TriviaQA)** (green dotted): Sharp spike to ~80% at layer 10, then declines to ~30% by layer 30.
- **A-Anchored (TriviaQA)** (red dash-dot): Gradual decline from ~70% to ~40%, with a plateau at layer 20.
- **Q-Anchored (HotpotQA)** (purple solid): Oscillates between 50–70%, with a peak at layer 25 (~80%).
- **A-Anchored (HotpotQA)** (gray dashed): Relatively flat (~50–60%), with a dip to ~40% at layer 15.
#### Right Chart (Mistral-7B-v0.3)
- **Q-Anchored (PopQA)** (blue solid): Peaks at ~80% at layer 10, then declines to ~50% by layer 30.
- **A-Anchored (PopQA)** (orange dashed): Stable between 50–70%, with a minor dip at layer 20.
- **Q-Anchored (TriviaQA)** (green dotted): Peaks at ~70% at layer 5, declines to ~40% by layer 30.
- **A-Anchored (TriviaQA)** (red dash-dot): Gradual decline from ~60% to ~30%, with a plateau at layer 15.
- **Q-Anchored (HotpotQA)** (purple solid): Peaks at ~75% at layer 20, then declines to ~50%.
- **A-Anchored (HotpotQA)** (gray dashed): Stable between 50–60%, with a dip to ~40% at layer 10.
- **Q-Anchored (NQ)** (pink dotted): Peaks at ~85% at layer 5, declines to ~40% by layer 30.
- **A-Anchored (NQ)** (gray dash-dot): Stable between 50–70%, with a peak at layer 25 (~80%).
---
### Key Observations
1. **Version Comparison**:
- v0.3 shows reduced variability in I-Don't-Know rates compared to v0.1 (narrower shaded confidence intervals).
- v0.1 exhibits sharper spikes (e.g., Q-Anchored TriviaQA at layer 10), while v0.3 trends are smoother.
2. **Anchoring Impact**:
- Q-Anchored models generally show higher I-Don't-Know rates than A-Anchored counterparts in both versions.
- Exceptions: A-Anchored (NQ) in v0.3 matches Q-Anchored (NQ) in variability.
3. **Dataset-Specific Trends**:
- **PopQA**: Q-Anchored models dominate in v0.1 but stabilize in v0.3.
- **TriviaQA**: Q-Anchored models exhibit extreme fluctuations in v0.1, mitigated in v0.3.
- **HotpotQA**: Q-Anchored models show late-layer spikes in v0.1 (layer 25) and v0.3 (layer 20).
4. **Outliers**:
- Q-Anchored (TriviaQA) in v0.1 has an anomalous spike at layer 10 (~80%), far exceeding other series.
- A-Anchored (NQ) in v0.3 peaks at layer 25 (~80%), matching Q-Anchored (NQ) in v0.3.
---
### Interpretation
The data suggests that anchoring methods (Q vs. A) and dataset types significantly influence model uncertainty. Q-Anchored models (e.g., PopQA, TriviaQA) exhibit higher I-Don't-Know rates, particularly in earlier layers, indicating potential over-reliance on specific training data. The reduction in variability in v0.3 implies architectural improvements or better generalization. The late-layer spikes in HotpotQA (v0.1/v0.3) may reflect domain-specific challenges. Notably, A-Anchored (NQ) in v0.3 performs comparably to Q-Anchored models, suggesting that anchoring strategy may be less critical for NQ datasets. These trends highlight trade-offs between specialization and robustness in model design.