## Line Chart: Router Stability Across Layers and Noise Levels
### Overview
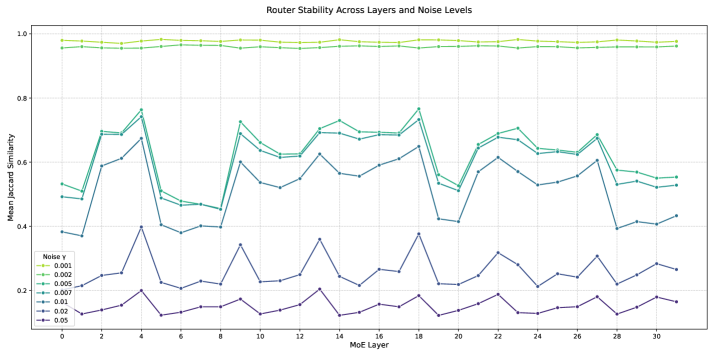
The image is a line chart showing the router stability across different MoE (Mixture of Experts) layers for various noise levels. The chart plots the Mean Jaccard Similarity (a measure of stability) against the MoE Layer number. Different colored lines represent different noise levels, as indicated in the legend.
### Components/Axes
* **Title:** Router Stability Across Layers and Noise Levels
* **X-axis:** MoE Layer (numbered from 0 to 31)
* **Y-axis:** Mean Jaccard Similarity (ranging from 0.0 to 1.0, with gridlines at intervals of 0.2)
* **Legend:** Located in the bottom-left corner, indicating the noise levels (Noise γ) corresponding to each line color:
* Yellow-Green: 0.001
* Light Green: 0.002
* Green: 0.005
* Dark Green: 0.007
* Teal: 0.01
* Dark Blue: 0.02
* Purple-Blue: 0.05
### Detailed Analysis
* **Noise γ = 0.001 (Yellow-Green):** This line remains relatively constant at a high Mean Jaccard Similarity of approximately 0.97 across all MoE layers.
* **Noise γ = 0.002 (Light Green):** This line also shows high stability, with the Mean Jaccard Similarity fluctuating slightly around 0.95.
* **Noise γ = 0.005 (Green):** This line shows more variation compared to the previous two, with the Mean Jaccard Similarity ranging from approximately 0.5 to 0.75. There are noticeable peaks and dips at various MoE layers.
* **Noise γ = 0.007 (Dark Green):** This line follows a similar trend to the 0.005 noise level, with the Mean Jaccard Similarity ranging from approximately 0.45 to 0.7.
* **Noise γ = 0.01 (Teal):** This line shows a lower Mean Jaccard Similarity, generally staying between 0.2 and 0.4. The line fluctuates, indicating varying stability across different layers.
* **Noise γ = 0.02 (Dark Blue):** This line exhibits the lowest Mean Jaccard Similarity, consistently below 0.3.
* **Noise γ = 0.05 (Purple-Blue):** This line shows a Mean Jaccard Similarity between 0.1 and 0.25.
### Key Observations
* Higher noise levels (0.01, 0.02, 0.05) result in lower Mean Jaccard Similarity, indicating reduced router stability.
* Lower noise levels (0.001, 0.002) maintain high and relatively constant Mean Jaccard Similarity, suggesting stable router performance.
* The intermediate noise levels (0.005, 0.007) show more variability in router stability across different MoE layers.
### Interpretation
The chart demonstrates the impact of noise on router stability within a Mixture of Experts (MoE) model. As the noise level increases, the Mean Jaccard Similarity decreases, indicating that the router becomes less stable. The MoE layers exhibit varying degrees of sensitivity to noise, as evidenced by the fluctuations in the Mean Jaccard Similarity for intermediate noise levels. The data suggests that maintaining low noise levels is crucial for ensuring stable router performance in MoE models. The consistent performance at noise levels 0.001 and 0.002 indicates a robust baseline, while the significant drop in stability at higher noise levels highlights the model's vulnerability to noisy environments.