## Line Chart: Router Stability Across Layers and Noise Levels
### Overview
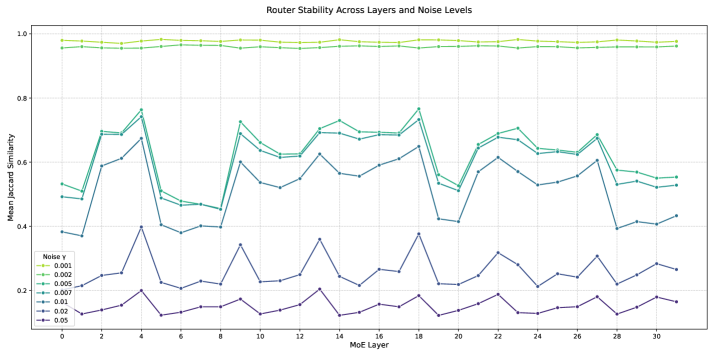
This is a line chart titled "Router Stability Across Layers and Noise Levels." It visualizes how the similarity of router match scores (a stability metric) changes across different layers of a Mixture-of-Experts (MoE) model, under varying levels of input noise. The chart demonstrates that router stability is highly sensitive to noise, with performance degrading significantly as noise increases.
### Components/Axes
* **Chart Title:** "Router Stability Across Layers and Noise Levels" (centered at the top).
* **Y-Axis:** Labeled "Match Score Similarity". The scale runs from 0.0 to 1.0, with major gridlines at intervals of 0.2 (0.0, 0.2, 0.4, 0.6, 0.8, 1.0).
* **X-Axis:** Labeled "MoE Layer". The scale runs from 0 to 30, with major tick marks and labels at every even number (0, 2, 4, ..., 30).
* **Legend:** Located in the bottom-left corner of the chart area. It lists 7 data series, each corresponding to a different noise level (`Noise σ`). Each entry includes a colored line with a distinct marker symbol.
* `Noise σ = 0.001` (Light green line, circle marker)
* `Noise σ = 0.002` (Yellow-green line, square marker)
* `Noise σ = 0.005` (Teal line, diamond marker)
* `Noise σ = 0.01` (Dark teal line, upward triangle marker)
* `Noise σ = 0.02` (Blue-gray line, downward triangle marker)
* `Noise σ = 0.03` (Dark blue line, left-pointing triangle marker)
* `Noise σ = 0.05` (Purple line, right-pointing triangle marker)
### Detailed Analysis
The chart plots 7 distinct data series, one for each noise level. The general trend is that **higher noise levels lead to lower match score similarity (less stability) and greater volatility across layers.**
**Trend Verification & Data Point Extraction (Approximate Values):**
1. **Noise σ = 0.001 & 0.002 (Top two lines):**
* **Trend:** These lines are nearly flat and positioned very high on the chart, indicating excellent and consistent stability.
* **Values:** Both lines hover between approximately **0.95 and 0.98** across all 30 layers, with minimal fluctuation. The `0.001` line is consistently the highest.
2. **Noise σ = 0.005 & 0.01 (Middle cluster of lines):**
* **Trend:** These lines show a distinct, repeating pattern of peaks and valleys. They are significantly lower than the low-noise lines.
* **Values:** They fluctuate roughly between **0.4 and 0.75**.
* **Key Peaks (approximate):** Layers 4, 14, 18, 22, 26.
* **Key Valleys (approximate):** Layers 6, 20, 28. The drop at layer 20 is particularly sharp for both series.
3. **Noise σ = 0.02 (Blue-gray line):**
* **Trend:** Follows a similar volatile pattern to the 0.005/0.01 lines but is shifted downward.
* **Values:** Fluctuates roughly between **0.35 and 0.65**. Its peaks and valleys align with the series above it.
4. **Noise σ = 0.03 & 0.05 (Bottom two lines):**
* **Trend:** These lines are the lowest and show the most pronounced volatility relative to their baseline. They exhibit sharp, jagged peaks.
* **Values:**
* `σ=0.03`: Ranges approximately from **0.2 to 0.4**.
* `σ=0.05`: Ranges approximately from **0.1 to 0.2**.
* **Key Peaks (approximate):** Both show notable peaks at layers 4, 14, 18, 22, 26, mirroring the pattern of the higher lines but at a much lower similarity score.
**Spatial Grounding:** The legend is positioned in the bottom-left, overlapping the lower portion of the y-axis. The data lines are plotted across the full width of the chart. The highest stability lines (`σ=0.001, 0.002`) occupy the top band of the plot area, while the lowest stability lines (`σ=0.03, 0.05`) occupy the bottom band.
### Key Observations
1. **Noise Threshold Effect:** There is a dramatic drop in stability when moving from very low noise (`σ=0.002`) to moderate noise (`σ=0.005`). The gap between these two lines is the largest on the chart.
2. **Layer-Specific Vulnerability:** Certain layers (notably 6, 20, and 28) show consistent dips in stability across multiple noise levels (`σ >= 0.005`). This suggests these layers in the MoE router are inherently more sensitive to perturbation.
3. **Pattern Synchronization:** The peaks and valleys for all noisy conditions (`σ >= 0.005`) are largely synchronized. This indicates that the layers which are robust or fragile to noise are consistent, regardless of the noise magnitude (above a threshold).
4. **Baseline Stability:** Under near-zero noise (`σ=0.001`), the router is extremely stable (similarity >0.95) across all layers, confirming the router's functionality in a clean setting.
### Interpretation
This chart provides a diagnostic view of an MoE router's robustness. The data suggests:
* **The router is highly robust to very small perturbations** (`σ <= 0.002`), maintaining near-perfect consistency in expert selection.
* **A critical noise threshold exists between `σ=0.002` and `σ=0.005`.** Beyond this point, the router's behavior becomes significantly less stable and more layer-dependent.
* **The synchronized volatility pattern reveals an architectural signature.** The layers that consistently show drops (6, 20, 28) may represent critical decision points or bottlenecks in the routing pathway where noise has a cascading effect. Conversely, the peaks (4, 14, 18, 22, 26) might correspond to layers with more redundant or stable routing logic.
* **Practical Implication:** For real-world deployment where input noise is inevitable, this analysis highlights the need for noise-robust training or architectural modifications, particularly targeting the identified vulnerable layers, to ensure consistent model performance. The router's stability is not uniform; it is a function of both layer depth and noise level.