## Line Graph: Router Stability Across Layers and Noise Levels
### Overview
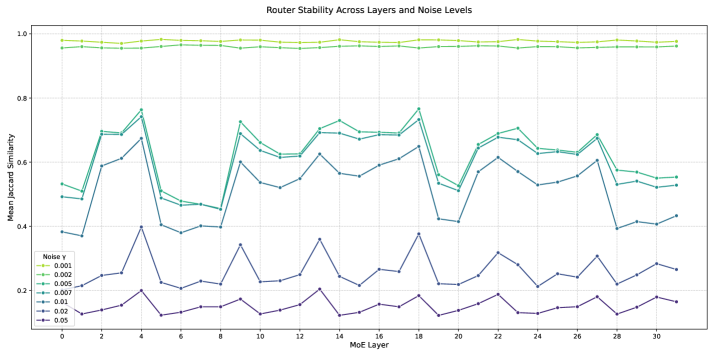
The image is a multi-line graph comparing router stability (measured as Mean Jaccard Similarity) across 31 M0E layers (0–30) under varying noise levels. Five data series represent noise levels of 0.001, 0.002, 0.005, 0.01, and 0.05. The graph highlights how stability degrades with increasing noise.
### Components/Axes
- **X-axis**: "M0E Layer" (0–30, increments of 2).
- **Y-axis**: "Mean Jaccard Similarity" (0.0–1.0, increments of 0.2).
- **Legend**: Located on the right, mapping colors to noise levels:
- Yellow: 0.001
- Green: 0.002
- Teal: 0.005
- Blue: 0.01
- Purple: 0.05
### Detailed Analysis
1. **Noise Level 0.001 (Yellow)**:
- **Trend**: Nearly flat line, maintaining Mean Jaccard Similarity between **0.98–0.99** across all layers.
- **Key Point**: Highest stability, with minimal deviation.
2. **Noise Level 0.002 (Green)**:
- **Trend**: Slight fluctuations but remains above **0.95** for most layers.
- **Key Point**: Occasional dips to ~0.93 at layers 4, 12, and 28.
3. **Noise Level 0.005 (Teal)**:
- **Trend**: Moderate variability, ranging from **0.60–0.75**.
- **Key Point**: Sharp drops at layers 4, 12, and 20 (e.g., ~0.55 at layer 4).
4. **Noise Level 0.01 (Blue)**:
- **Trend**: Significant instability, with values between **0.40–0.65**.
- **Key Point**: Peaks at layers 2, 10, and 26 (~0.65), but dips to ~0.40 at layers 6 and 24.
5. **Noise Level 0.05 (Purple)**:
- **Trend**: Most unstable, fluctuating between **0.15–0.35**.
- **Key Point**: Sharpest drops at layers 4, 12, and 20 (e.g., ~0.15 at layer 4).
### Key Observations
- **Noise Correlation**: Higher noise levels consistently correlate with lower stability. The 0.05 noise level shows the most erratic behavior.
- **Layer-Specific Anomalies**: Layers 4, 12, and 20 exhibit pronounced stability drops across all noise levels, suggesting systemic vulnerabilities.
- **Stability Thresholds**: Noise levels above 0.01 result in Mean Jaccard Similarity below 0.65, indicating critical degradation.
### Interpretation
The data demonstrates that router stability is highly sensitive to noise. Lower noise levels (≤0.005) maintain high similarity scores (>0.95), suggesting robust performance. As noise increases, stability declines sharply, with noise ≥0.01 causing Mean Jaccard Similarity to fall below 0.65. The recurring dips at specific layers (4, 12, 20) imply potential design flaws or bottlenecks in those M0E layers. This analysis underscores the importance of noise mitigation strategies to preserve network reliability.