## Flowchart: Accuracy Assessment
### Overview
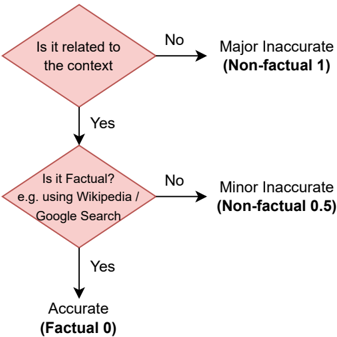
The image is a flowchart illustrating a decision process for assessing the accuracy of information. It starts with a check for relevance to the context, then checks for factual accuracy, leading to classifications of "Accurate," "Minor Inaccurate," or "Major Inaccurate."
### Components/Axes
* **Nodes:** The flowchart consists of diamond-shaped decision nodes and rectangular outcome nodes.
* **Decision Nodes:**
* "Is it related to the context?"
* "Is it Factual? e.g. using Wikipedia / Google Search"
* **Outcome Nodes:**
* "Accurate (Factual 0)"
* "Major Inaccurate (Non-factual 1)"
* "Minor Inaccurate (Non-factual 0.5)"
* **Flow Direction:** The flow is top-to-bottom, with branches based on "Yes" or "No" answers to the decision questions.
### Detailed Analysis or ### Content Details
1. **Start:** The flowchart begins with the question "Is it related to the context?"
* If the answer is "No," the outcome is "Major Inaccurate (Non-factual 1)."
* If the answer is "Yes," the flow proceeds to the next question.
2. **Second Question:** "Is it Factual? e.g. using Wikipedia / Google Search"
* If the answer is "No," the outcome is "Minor Inaccurate (Non-factual 0.5)."
* If the answer is "Yes," the outcome is "Accurate (Factual 0)."
### Key Observations
* The flowchart provides a structured method for categorizing information based on relevance and factual accuracy.
* The outcomes are assigned numerical values: 0 for accurate, 0.5 for minor inaccuracy, and 1 for major inaccuracy.
### Interpretation
The flowchart outlines a simple algorithm for assessing the quality of information. It prioritizes relevance before factual accuracy, suggesting that even factually correct information can be considered "Major Inaccurate" if it is not relevant to the context. The use of numerical values for the outcomes implies a potential for quantitative analysis or scoring of information quality. The reference to Wikipedia and Google Search suggests a practical approach to fact-checking.