# Technical Data Extraction: Performance and Prediction Accuracy Analysis
This document contains a detailed extraction of data from two side-by-side technical charts comparing model performance (log-likelihood) against FLOPs and the accuracy of a top-k predictor over training steps.
---
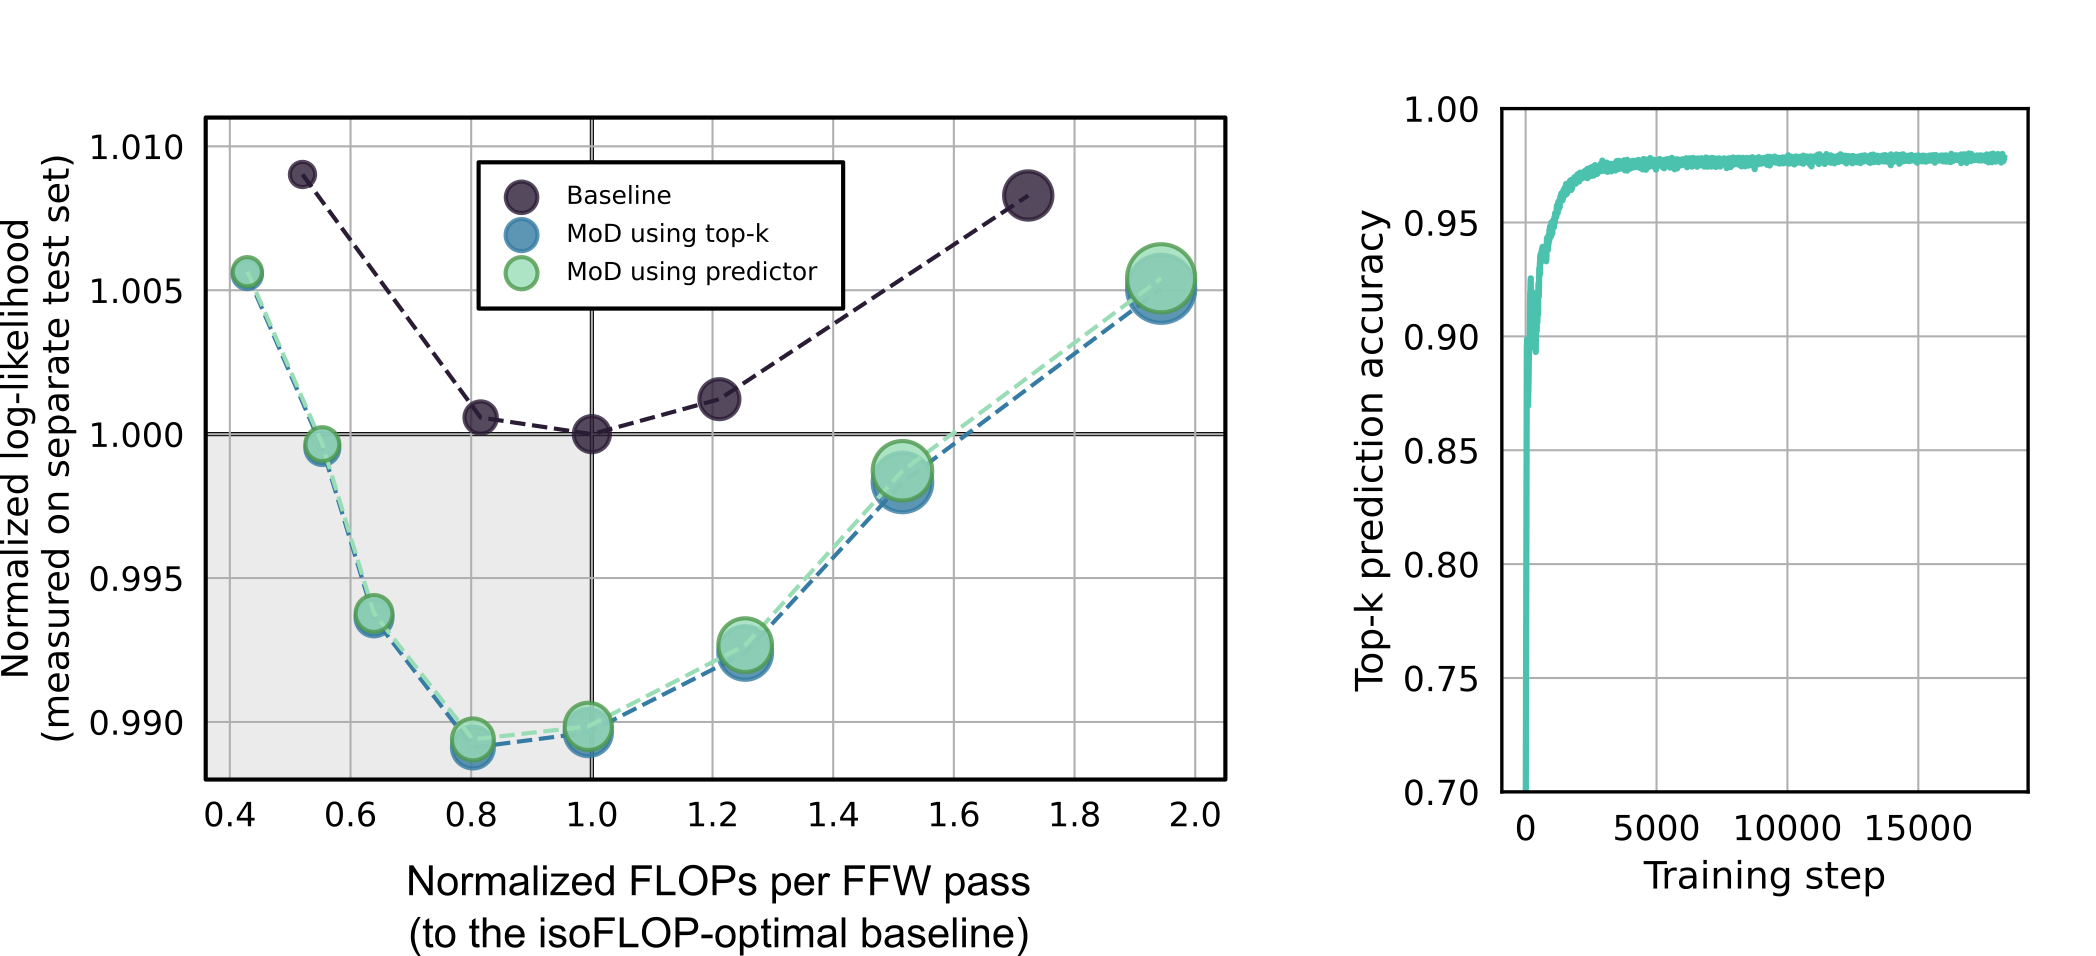
## Chart 1: Performance vs. Computational Cost
### Metadata and Axes
* **Type:** Scatter plot with dashed connecting lines.
* **Y-Axis Label:** Normalized log-likelihood (measured on separate test set)
* **Y-Axis Range:** 0.988 to 1.010 (Markers at 0.990, 0.995, 1.000, 1.005, 1.010)
* **X-Axis Label:** Normalized FLOPs per FFW pass (to the isoFLOP-optimal baseline)
* **X-Axis Range:** 0.4 to 2.0 (Markers at 0.4, 0.6, 0.8, 1.0, 1.2, 1.4, 1.6, 1.8, 2.0)
* **Reference Lines:**
* A horizontal solid black line at $y = 1.000$.
* A vertical solid black line at $x = 1.0$.
* **Legend Location:** Top-center, inside the plot area.
### Data Series Extraction
#### 1. Baseline (Dark Purple Circles, Dark Dashed Line)
* **Trend:** Forms a "U" shape. Performance improves (log-likelihood decreases) as FLOPs increase toward 1.0, then degrades as FLOPs increase further.
* **Data Points (Approximate):**
* [0.52, 1.009]
* [0.81, 1.001]
* [1.00, 1.000] (Intersection of reference lines)
* [1.28, 1.001]
* [1.72, 1.008]
#### 2. MoD using top-k (Blue Circles, Blue Dashed Line)
* **Trend:** Follows a similar "U" shape but shifted lower (better performance) than the baseline. It reaches its minimum log-likelihood around 0.8 to 1.0 FLOPs.
* **Data Points (Approximate):**
* [0.43, 1.006]
* [0.56, 0.999]
* [0.64, 0.994]
* [0.80, 0.989]
* [1.00, 0.990]
* [1.25, 0.992]
* [1.51, 0.998]
* [1.95, 1.005]
#### 3. MoD using predictor (Light Green Circles, Light Green Dashed Line)
* **Trend:** Nearly identical to the "MoD using top-k" series, indicating that the predictor-based routing performs as well as the ground-truth top-k routing.
* **Data Points:** Overlays the Blue series almost perfectly across all X-axis values.
---
## Chart 2: Predictor Training Progress
### Metadata and Axes
* **Type:** Line graph.
* **Y-Axis Label:** Top-k prediction accuracy
* **Y-Axis Range:** 0.70 to 1.00 (Markers every 0.05)
* **X-Axis Label:** Training step
* **X-Axis Range:** 0 to 15,000+ (Markers at 0, 5000, 10000, 15000)
### Data Series Extraction
#### Top-k Prediction Accuracy (Teal/Green Solid Line)
* **Trend:** Rapid logarithmic growth in the initial phase, followed by a plateau.
* **Key Phases:**
* **Initial (0 - 1,000 steps):** Sharp vertical ascent from below 0.70 to approximately 0.93.
* **Transition (1,000 - 3,000 steps):** Continued growth with slight noise, reaching ~0.97.
* **Plateau (3,000 - 18,000 steps):** The accuracy stabilizes and remains extremely consistent between 0.97 and 0.98 for the remainder of the training duration.
---
## Summary of Findings
1. **Efficiency:** Both Mixture-of-Depths (MoD) variants achieve lower (better) log-likelihood than the baseline across the entire FLOP spectrum shown.
2. **Optimal Point:** The MoD models achieve their best performance at approximately 0.8x the FLOPs of the isoFLOP-optimal baseline.
3. **Predictor Reliability:** The "MoD using predictor" matches the "top-k" performance, supported by the second chart showing the predictor reaches >97% accuracy very early in the training process (by step 3,000).