## Flowchart: Pseudo Gradients Penalty and Outer Optimization Process
### Overview
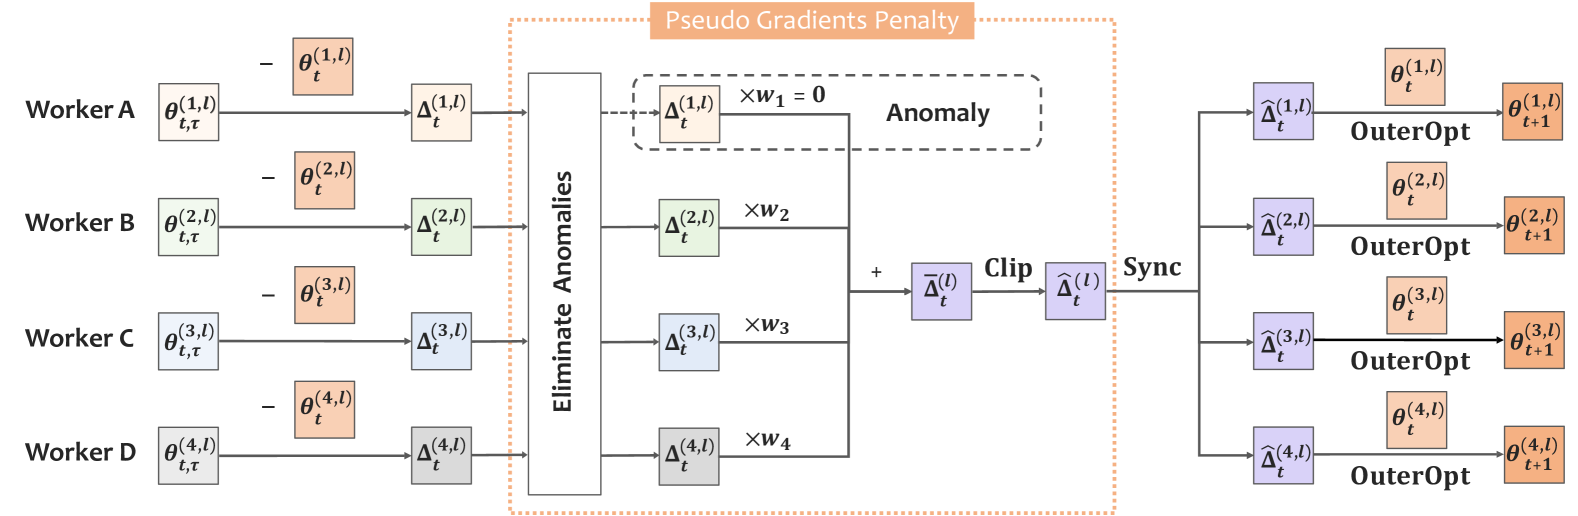
The diagram illustrates a multi-stage technical process involving four workers (A-D) with parameter adjustments, anomaly elimination, and outer optimization. Key components include parameter updates (θ), gradient calculations (Δ), anomaly detection, and synchronization steps. The process uses color-coded elements to distinguish between different stages and components.
### Components/Axes
1. **Left Section (Pseudo Gradients Penalty):**
- **Workers A-D:** Four parallel processing units with parameters θ(t,l) (input) and Δ(t,l) (output).
- **Anomaly Detection:** Dashed box labeled "Anomaly" with equation Δ(t,l) × w₁ = 0 (w₁=0 explicitly noted).
- **Eliminate Anomalies:** Block processing Δ(t,l) values with weights w₂-w₄ (no explicit values provided).
- **Color Legend:** Orange (θ), Green (Δ), Blue (Δ), Purple (Δ) for different components.
2. **Right Section (OuterOpt):**
- **Synchronization (Sync):** Central step connecting all workers.
- **Clipping (Clip):** Operation applied to Δ̄(t,l) before synchronization.
- **Outer Optimization:** Final parameter updates (θ(t+1,l)) with "OuterOpt" labels.
- **Color Legend:** Matches left section (orange/green/blue/purple) for consistency.
### Detailed Analysis
- **Worker Parameters:** Each worker (A-D) has θ(t,l) → Δ(t,l) flow, with Δ(t,l) values differentiated by color (orange, green, blue, purple).
- **Anomaly Handling:** Worker A's Δ(t,l) is explicitly set to zero (w₁=0), while others (w₂-w₄) are scaled but no numerical values provided.
- **OuterOpt Process:** All workers undergo clipping (Δ̄(t,l)) and synchronization before final parameter updates (θ(t+1,l)).
### Key Observations
1. **Anomaly Exclusion:** Worker A's anomaly is fully eliminated (w₁=0), while others retain scaled values.
2. **Color Consistency:** Orange consistently represents initial parameters (θ), while Δ values use green/blue/purple.
3. **Process Flow:** Sequential steps from parameter updates → anomaly filtering → outer optimization.
### Interpretation
This diagram represents a distributed optimization system where:
1. **Worker Parameters** are individually adjusted (θ → Δ)
2. **Anomalies** are filtered using weighted penalties (notably excluding Worker A)
3. **Global Optimization** occurs through clipping and synchronization before final parameter updates
The use of color coding and explicit zero-weight for Worker A suggests a prioritization mechanism where certain worker contributions are intentionally excluded during anomaly handling. The "OuterOpt" step implies a second-order optimization process beyond basic gradient calculations.