## Diagram: Intelligence Alignment Models
### Overview
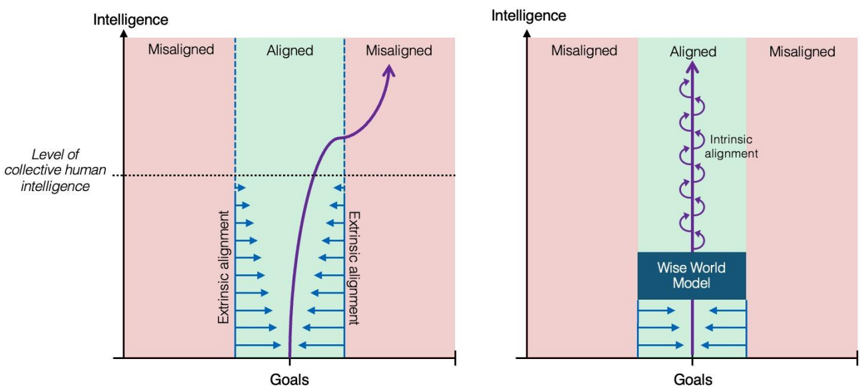
The image presents two diagrams illustrating different models of intelligence alignment with goals. Both diagrams share a common structure with "Intelligence" on the vertical axis and "Goals" on the horizontal axis. The space is divided into three vertical regions labeled "Misaligned," "Aligned," and "Misaligned" again. The first diagram shows a curved line representing a trajectory that starts with extrinsic alignment and then veers into misalignment. The second diagram shows a straight, oscillating line representing intrinsic alignment.
### Components/Axes
* **Vertical Axis:** "Intelligence"
* **Horizontal Axis:** "Goals"
* **Horizontal Dotted Line:** "Level of collective human intelligence"
* **Vertical Regions:**
* "Misaligned" (left) - colored light red
* "Aligned" (center) - colored light green
* "Misaligned" (right) - colored light red
* **Diagram 1:**
* "Extrinsic alignment" - blue arrows pointing right within the "Misaligned" region, and blue arrows pointing left within the "Aligned" region.
* **Diagram 2:**
* "Wise World Model" - a blue rectangle at the bottom of the "Aligned" region.
* "Intrinsic alignment" - blue arrows pointing right and left along the vertical line within the "Aligned" region.
### Detailed Analysis
**Diagram 1: Extrinsic Alignment**
* **Trend:** The purple line starts in the "Aligned" region, initially rising slowly, then curves sharply to the right into the "Misaligned" region, continuing to rise.
* The purple line starts at the bottom of the "Aligned" region, below the "Level of collective human intelligence" line.
* The purple line crosses the "Level of collective human intelligence" line as it enters the "Misaligned" region.
* The "Extrinsic alignment" arrows are present at the bottom, pointing towards the "Aligned" region from the left "Misaligned" region, and pointing towards the "Misaligned" region from the "Aligned" region.
**Diagram 2: Intrinsic Alignment**
* **Trend:** The purple line rises vertically within the "Aligned" region, with small horizontal oscillations.
* The purple line starts at the top of the "Wise World Model" rectangle.
* The "Intrinsic alignment" arrows are present along the vertical purple line, alternating direction.
* The "Wise World Model" rectangle is at the bottom of the "Aligned" region.
* Blue arrows point from the "Wise World Model" downwards into the "Goals" axis.
### Key Observations
* Both diagrams illustrate the relationship between intelligence, goals, and alignment.
* The first diagram depicts a scenario where initial alignment degrades into misalignment as intelligence increases.
* The second diagram depicts a scenario where alignment is maintained through intrinsic mechanisms.
* The "Level of collective human intelligence" acts as a threshold in the first diagram, beyond which misalignment occurs.
### Interpretation
The diagrams present two contrasting approaches to aligning artificial intelligence (or any intelligence) with desired goals. The first diagram suggests that relying solely on extrinsic alignment (e.g., external rewards or constraints) can lead to misalignment as the intelligence becomes more sophisticated. The second diagram proposes that intrinsic alignment (e.g., internal motivations or values) is necessary to maintain alignment even as intelligence grows. The "Wise World Model" likely represents a system designed to promote intrinsic alignment. The horizontal dotted line representing the "Level of collective human intelligence" suggests a point where the complexity of the intelligence requires a shift from extrinsic to intrinsic alignment strategies. The oscillating arrows in the second diagram could represent a continuous feedback loop or self-correction mechanism that maintains alignment.