## Chart/Diagram Type: Multi-Panel Analysis
### Overview
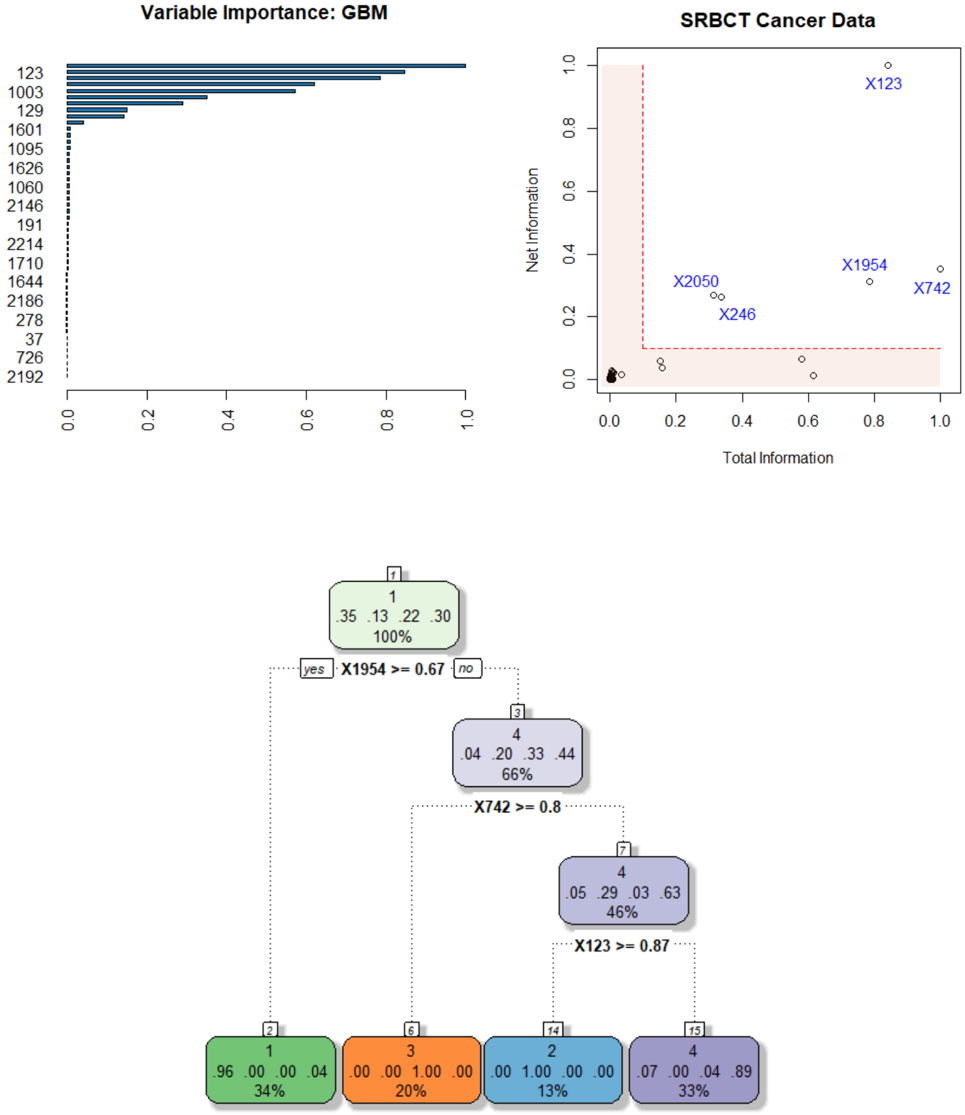
The image presents a multi-panel analysis consisting of a variable importance chart (GBM), a scatter plot of SRBCT Cancer Data, and a decision tree. The variable importance chart ranks variables by their importance. The scatter plot visualizes the distribution of cancer data based on total and net information. The decision tree outlines a classification process based on variable thresholds.
### Components/Axes
**Panel 1: Variable Importance: GBM**
* **Title:** Variable Importance: GBM
* **Y-axis:** List of variables (123, 1003, 129, 1601, 1095, 1626, 1060, 2146, 191, 2214, 1710, 1644, 2186, 278, 37, 726, 2192)
* **X-axis:** Variable Importance, ranging from 0.0 to 1.0
**Panel 2: SRBCT Cancer Data**
* **Title:** SRBCT Cancer Data
* **X-axis:** Total Information, ranging from 0.0 to 1.0
* **Y-axis:** Net Information, ranging from 0.0 to 1.0
* **Data Points:** Scatter plot points labeled with identifiers such as X123, X1954, X2050, X246, X742.
* **Highlighted Region:** A shaded red/orange rectangle in the bottom-left corner, bounded by x=0 to ~0.2 and y=0 to ~0.1.
**Panel 3: Decision Tree**
* **Nodes:** Represented by rounded rectangles, each containing:
* Node Number (top)
* Class Distribution (four values)
* Percentage of Samples (bottom)
* **Branches:** Represented by dotted lines, each labeled with a decision rule (e.g., "X1954 >= 0.67").
* **Terminal Nodes (Leaves):** Colored rounded rectangles at the bottom of the tree. Colors are green, orange, blue, and purple.
### Detailed Analysis or ### Content Details
**Panel 1: Variable Importance: GBM**
* **Trend:** The variable importance decreases as you go down the list.
* **Top Variables:**
* 123: Importance ~ 0.95
* 1003: Importance ~ 0.75
* 129: Importance ~ 0.65
* 1601: Importance ~ 0.35
* **Least Important Variables:** The variables at the bottom of the list (e.g., 2192) have very low importance, close to 0.0.
**Panel 2: SRBCT Cancer Data**
* **Data Point Locations:**
* X123: Total Information ~ 0.85, Net Information ~ 0.9
* X1954: Total Information ~ 0.75, Net Information ~ 0.3
* X2050: Total Information ~ 0.3, Net Information ~ 0.3
* X246: Total Information ~ 0.4, Net Information ~ 0.2
* X742: Total Information ~ 0.95, Net Information ~ 0.3
* **Cluster:** A cluster of points is located near the origin (0, 0), within the highlighted red/orange rectangle.
**Panel 3: Decision Tree**
* **Root Node (Node 1):**
* Node Number: 1
* Class Distribution: .35, .13, .22, .30
* Percentage: 100%
* **First Split:** X1954 >= 0.67
* Yes Branch leads to Node 3
* No Branch leads to Node 4
* **Node 3:**
* Node Number: 3
* Class Distribution: .04, .20, .33, .44
* Percentage: 66%
* **Second Split (from Node 3):** X742 >= 0.8
* Yes Branch leads to Node 7
* No Branch leads to Node 6
* **Node 7:**
* Node Number: 7
* Class Distribution: .05, .29, .03, .63
* Percentage: 46%
* **Third Split (from Node 7):** X123 >= 0.87
* Yes Branch leads to Node 14
* No Branch leads to Node 15
* **Terminal Nodes:**
* Node 2 (Green): .96, .00, .00, .04, 34%
* Node 6 (Orange): .00, .00, 1.00, .00, 20%
* Node 14 (Blue): .00, 1.00, .00, .00, 13%
* Node 15 (Purple): .07, .00, .04, .89, 33%
### Key Observations
* Variable 123 is the most important variable according to the GBM model.
* The SRBCT cancer data shows distinct clusters based on total and net information.
* The decision tree uses X1954, X742, and X123 to classify the data.
* The terminal nodes of the decision tree have varying class distributions.
### Interpretation
The multi-panel analysis provides insights into variable importance, data distribution, and classification rules for SRBCT cancer data. The GBM model identifies key variables, while the scatter plot visualizes the relationships between total and net information. The decision tree offers a rule-based approach for classifying the data, potentially aiding in diagnosis or prognosis. The decision tree uses the variables identified as important by the GBM (e.g. 123) to create splits. The scatterplot shows how the data is distributed in terms of total and net information, and the decision tree attempts to create rules to separate the data points into different classes.