## Decision Tree: GBM Variable Importance & SRBCT Cancer Data
### Overview
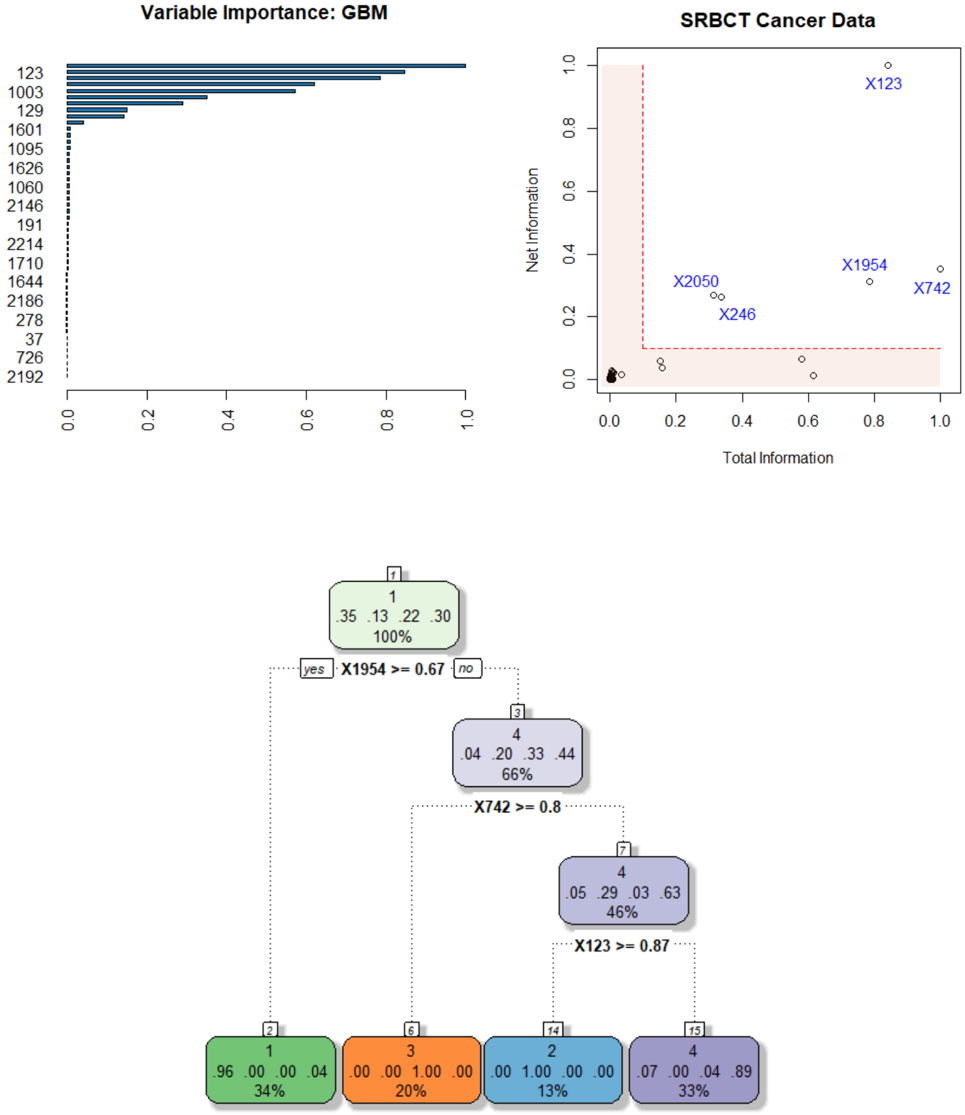
The image presents a decision tree visualization, likely generated from a Gradient Boosting Machine (GBM) model, alongside a scatter plot showing the relationship between Total Information and Net Information for SRBCT cancer data points. The decision tree illustrates splits based on variable importance, with associated probabilities and node counts. The scatter plot displays individual data points labeled with identifiers (X123, X2050, etc.).
### Components/Axes
* **Left:** Bar chart titled "Variable Importance: GBM". X-axis represents variable importance (0.0 to 1.0), Y-axis displays variable identifiers (123, 1003, 129, etc.).
* **Right:** Scatter plot titled "SRBCT Cancer Data". X-axis: "Total Information" (0.0 to 1.0). Y-axis: "Net Information" (0.0 to 1.0).
* **Center:** Decision tree diagram with nodes representing splits and leaves indicating outcomes ("yes" or "no"). Nodes contain probabilities and percentages.
* **Legend (Scatter Plot):** Located in the top-right corner, color-coded data points: X123 (Red), X1954 (Blue), X2050 (Orange), X246 (Green), X742 (Purple).
### Detailed Analysis or Content Details
**Variable Importance (Bar Chart):**
The bar chart shows the relative importance of different variables in the GBM model. The bars are arranged in descending order of importance. Approximate values (with uncertainty due to visual estimation):
* 2192: ~0.98
* 1710: ~0.95
* 1644: ~0.93
* 1095: ~0.92
* 1601: ~0.90
* 129: ~0.85
* 1003: ~0.80
* 123: ~0.75
* 726: ~0.70
* 37: ~0.60
* 278: ~0.50
* 2186: ~0.45
* 1191: ~0.40
* 2214: ~0.35
**SRBCT Cancer Data (Scatter Plot):**
The scatter plot shows the distribution of data points based on Total and Net Information.
* X123 (Red): Total Information ~0.95, Net Information ~0.90
* X1954 (Blue): Total Information ~0.85, Net Information ~0.30
* X2050 (Orange): Total Information ~0.30, Net Information ~0.60
* X246 (Green): Total Information ~0.10, Net Information ~0.20
* X742 (Purple): Total Information ~0.90, Net Information ~0.20
The points are relatively sparse, with X123 having the highest values for both Total and Net Information.
**Decision Tree:**
The decision tree shows a series of splits based on variable thresholds.
* **Root Node (Top):** 100% of data.
* **Split 1:** X1954 >= 0.67. "yes" branch (35% of data) and "no" branch (65% of data).
* **"yes" Branch:** 35% of data.
* Split 2: X742 >= 0.8. "yes" branch (4% of data) and "no" branch (31% of data).
* **"no" Branch:** 65% of data.
* Split 3: X742 >= 0.8. "yes" branch (33% of data) and "no" branch (32% of data).
* **Leaf Nodes:** Represent final outcomes.
* Node 2: 96, 0.04, 0.00, 34%
* Node 3: 0.05, 0.29, 0.03, 46%
* Node 4: 0.00, 1.00, 0.00, 20%
* Node 5: 0.07, 0.04, 0.89, 33%
* Node 6: 3, 4, 63%
* Node 7: 1, 4, 33%
### Key Observations
* Variables 2192 and 1710 are the most important in the GBM model, according to the bar chart.
* X123 stands out in the scatter plot as having both high Total and Net Information.
* The decision tree shows a hierarchical splitting process, with X1954 and X742 being key variables in the initial splits.
* The leaf nodes indicate the final classification outcomes, with associated probabilities.
### Interpretation
The image illustrates the process of building and evaluating a predictive model (GBM) for SRBCT cancer data. The variable importance plot identifies the features that contribute most to the model's predictive power. The scatter plot provides a visual representation of the data distribution in terms of Total and Net Information, potentially highlighting data points that are more informative or representative of specific cancer subtypes. The decision tree shows how the model makes predictions based on a series of rules derived from the data.
The combination of these visualizations allows for a comprehensive understanding of the model's behavior and the underlying data characteristics. The high importance of variables 2192 and 1710 suggests that these features are strongly correlated with the outcome being predicted. The outlier X123 in the scatter plot may represent a unique case or a data point with particularly strong predictive signals. The decision tree provides a transparent view of the model's decision-making process, allowing for validation and interpretation. The percentages at each node represent the proportion of samples that follow each branch, providing insights into the prevalence of different outcomes.