TECHNICAL ASSET FINGERPRINT
0659aee03891fa44084306d8
Click to view fullscreen
Press ESC or click to close
FOUND IN PAPERS
EXPERT: healer-alpha-free VERSION 1
RUNTIME: free/openrouter/healer-alpha
INTEL_VERIFIED
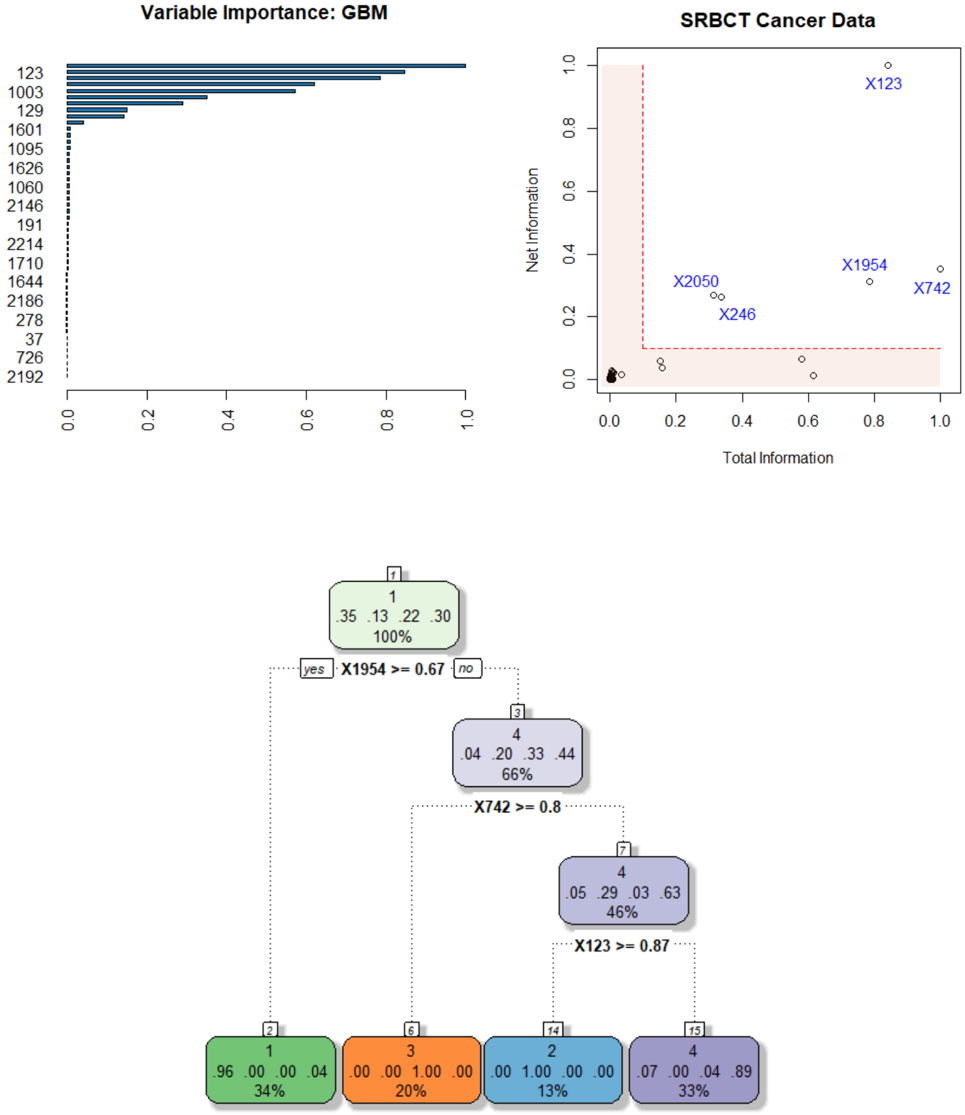
## Multi-Panel Technical Visualization: GBM Variable Importance, SRBCT Cancer Data Scatter Plot, and Decision Tree
### Overview
The image is a composite of three distinct technical visualizations related to machine learning model analysis, likely for a cancer classification task (SRBCT: Small Round Blue Cell Tumors). The top-left panel shows a variable importance plot from a Gradient Boosting Machine (GBM). The top-right panel is a scatter plot comparing "Total Information" vs. "Net Information" for specific variables. The bottom panel is a decision tree diagram illustrating a classification rule set. The visualizations appear to be from a statistical software output (e.g., R).
### Components/Axes
**1. Top-Left Panel: Variable Importance: GBM**
* **Type:** Horizontal Bar Chart.
* **Title:** "Variable Importance: GBM".
* **Y-axis (Vertical):** Lists variable identifiers (likely gene or feature IDs). From top to bottom: `123`, `1003`, `129`, `1601`, `1095`, `1626`, `1060`, `2146`, `191`, `2214`, `1710`, `1644`, `2186`, `278`, `37`, `726`, `2192`.
* **X-axis (Horizontal):** Represents importance score, scaled from `0.0` to `1.0`. Major tick marks at `0.0`, `0.2`, `0.4`, `0.6`, `0.8`, `1.0`.
* **Data Series:** A single series of horizontal bars, colored dark blue. The length of each bar corresponds to the importance value.
**2. Top-Right Panel: SRBCT Cancer Data**
* **Type:** Scatter Plot.
* **Title:** "SRBCT Cancer Data".
* **X-axis (Horizontal):** Labeled "Total Information". Scale from `0.0` to `1.0`. Major tick marks at `0.0`, `0.2`, `0.4`, `0.6`, `0.8`, `1.0`.
* **Y-axis (Vertical):** Labeled "Net Information". Scale from `0.0` to `1.0`. Major tick marks at `0.0`, `0.2`, `0.4`, `0.6`, `0.8`, `1.0`.
* **Data Points:** Multiple circular points plotted. Several are labeled with blue text: `X123`, `X1954`, `X742`, `X2050`, `X246`. There is a cluster of unlabeled points near the origin (0,0).
* **Annotations:** Two red dashed lines form an L-shaped boundary. One vertical line at approximately `Total Information = 0.1`. One horizontal line at approximately `Net Information = 0.1`. The area to the left of the vertical line and below the horizontal line is shaded in a light pink/peach color.
**3. Bottom Panel: Decision Tree Diagram**
* **Type:** Decision Tree (Classification).
* **Structure:** Hierarchical tree with nodes and directional arrows.
* **Root Node (Top):**
* Label: `1` (likely class 1).
* Distribution: `.35 .13 .22 .30` (probabilities for 4 classes).
* Coverage: `100%` of data.
* **First Split:** Condition `X1954 >= 0.67`.
* **Yes (Left) Branch:** Leads directly to a leaf node.
* **No (Right) Branch:** Leads to an internal node.
* **Internal Node (Right of First Split):**
* Label: `4` (likely class 4).
* Distribution: `.04 .20 .33 .44`.
* Coverage: `66%` of data.
* **Second Split:** Condition `X742 >= 0.8`.
* **Yes (Left) Branch:** Leads to another internal node.
* **No (Right) Branch:** Leads to a leaf node.
* **Internal Node (Left of Second Split):**
* Label: `4` (likely class 4).
* Distribution: `.05 .29 .03 .63`.
* Coverage: `46%` of data.
* **Third Split:** Condition `X123 >= 0.87`.
* **Yes (Left) Branch:** Leads to a leaf node.
* **No (Right) Branch:** Leads to a leaf node.
* **Leaf Nodes (Bottom Row, from left to right):**
1. **Green Node:** Label `1`. Distribution `.96 .00 .00 .04`. Coverage `34%`. (Reached via `X1954 >= 0.67` = Yes).
2. **Orange Node:** Label `3`. Distribution `.00 .00 1.00 .00`. Coverage `20%`. (Reached via `X1954 >= 0.67` = No, `X742 >= 0.8` = No).
3. **Blue Node:** Label `2`. Distribution `.00 1.00 .00 .00`. Coverage `13%`. (Reached via `X1954 >= 0.67` = No, `X742 >= 0.8` = Yes, `X123 >= 0.87` = Yes).
4. **Purple Node:** Label `4`. Distribution `.07 .00 .04 .89`. Coverage `33%`. (Reached via `X1954 >= 0.67` = No, `X742 >= 0.8` = Yes, `X123 >= 0.87` = No).
### Detailed Analysis
**Variable Importance (GBM):**
The variable `123` has the highest importance, with a bar extending to approximately `0.98`. The next most important are `1003` (~`0.85`), `129` (~`0.65`), and `1601` (~`0.55`). Importance drops off sharply after the top 4-5 variables. Variables `37`, `726`, and `2192` have very low importance, near `0.0`.
**SRBCT Cancer Data (Scatter Plot):**
* **Point X123:** Located at approximately (Total=0.85, Net=0.98). This point has very high values on both axes, indicating it carries high total and net information.
* **Point X1954:** Located at approximately (Total=0.80, Net=0.32).
* **Point X742:** Located at approximately (Total=1.0, Net=0.30).
* **Point X2050:** Located at approximately (Total=0.35, Net=0.28).
* **Point X246:** Located at approximately (Total=0.38, Net=0.22).
* **Cluster near origin:** Multiple points with Total Information < 0.1 and Net Information < 0.1, falling within the shaded "low information" region.
* **Trend:** There is no simple linear correlation. Points are scattered. The labeled points (X123, X1954, X742, X2050, X246) all lie outside the shaded low-information region, suggesting they are informative features. X123 is an outlier with exceptionally high Net Information.
**Decision Tree:**
The tree uses three features for splits: `X1954`, `X742`, and `X123`. These are the same features highlighted in the scatter plot.
* **Primary Split:** `X1954 >= 0.67`. If true (34% of data), the model predicts Class 1 with very high confidence (96% probability).
* **Secondary Splits:** For data where `X1954 < 0.67`, the model further splits on `X742` and then `X123` to isolate pure or nearly pure classes:
* Class 3 is isolated when `X742 < 0.8`.
* Class 2 is isolated when `X742 >= 0.8` and `X123 >= 0.87`.
* Class 4 is the default for the remaining group (`X742 >= 0.8` and `X123 < 0.87`).
### Key Observations
1. **Feature Consistency:** The variables identified as most important in the GBM plot (`123`, `1954`, `742`) are the exact ones used as splitting criteria in the decision tree and are prominently labeled in the scatter plot. This indicates a strong consensus across different analytical methods about which features are key for classifying SRBCT data.
2. **X123 is Dominant:** Variable `123` (or `X123`) is the top variable in the GBM importance plot, has the highest "Net Information" in the scatter plot, and is the final splitting criterion in the decision tree to separate Class 2 from Class 4.
3. **Clear Class Separation:** The decision tree achieves very pure leaf nodes, especially for Classes 1, 2, and 3, suggesting the selected features provide strong discriminatory power.
4. **Information Threshold:** The scatter plot's shaded region and dashed lines suggest a heuristic threshold (Total Info > 0.1, Net Info > 0.1) for considering a feature "informative." All labeled points exceed this threshold.
### Interpretation
This composite visualization provides a multi-faceted view of a machine learning model built for a cancer classification task (SRBCT). The analysis suggests that a small subset of features (particularly X123, X1954, X742) contains the majority of the predictive signal.
* **The GBM Importance Plot** ranks features by their overall contribution to model predictive power across all trees in the ensemble.
* **The Scatter Plot** provides a different lens, decomposing a feature's value into "Total Information" (likely its raw predictive power or variance explained) and "Net Information" (possibly its unique contribution after accounting for correlations with other features). X123's position indicates it is both highly predictive and provides unique information.
* **The Decision Tree** reveals the explicit, interpretable logic derived from these key features. It shows a hierarchical decision process: first, a high value of X1954 strongly indicates Class 1. In its absence, a combination of X742 and X123 values cleanly separates the remaining classes.
**Conclusion:** The data demonstrates that the SRBCT cancer subtypes can be effectively classified using a parsimonious set of biomarkers. The convergence of evidence from variable importance, information metrics, and decision rules strengthens the validity of these features as potential diagnostic indicators. The model is highly interpretable, with clear, actionable decision paths based on measurable feature values.
DECODING INTELLIGENCE...