## Bar Chart: Variable Importance: GBM
### Overview
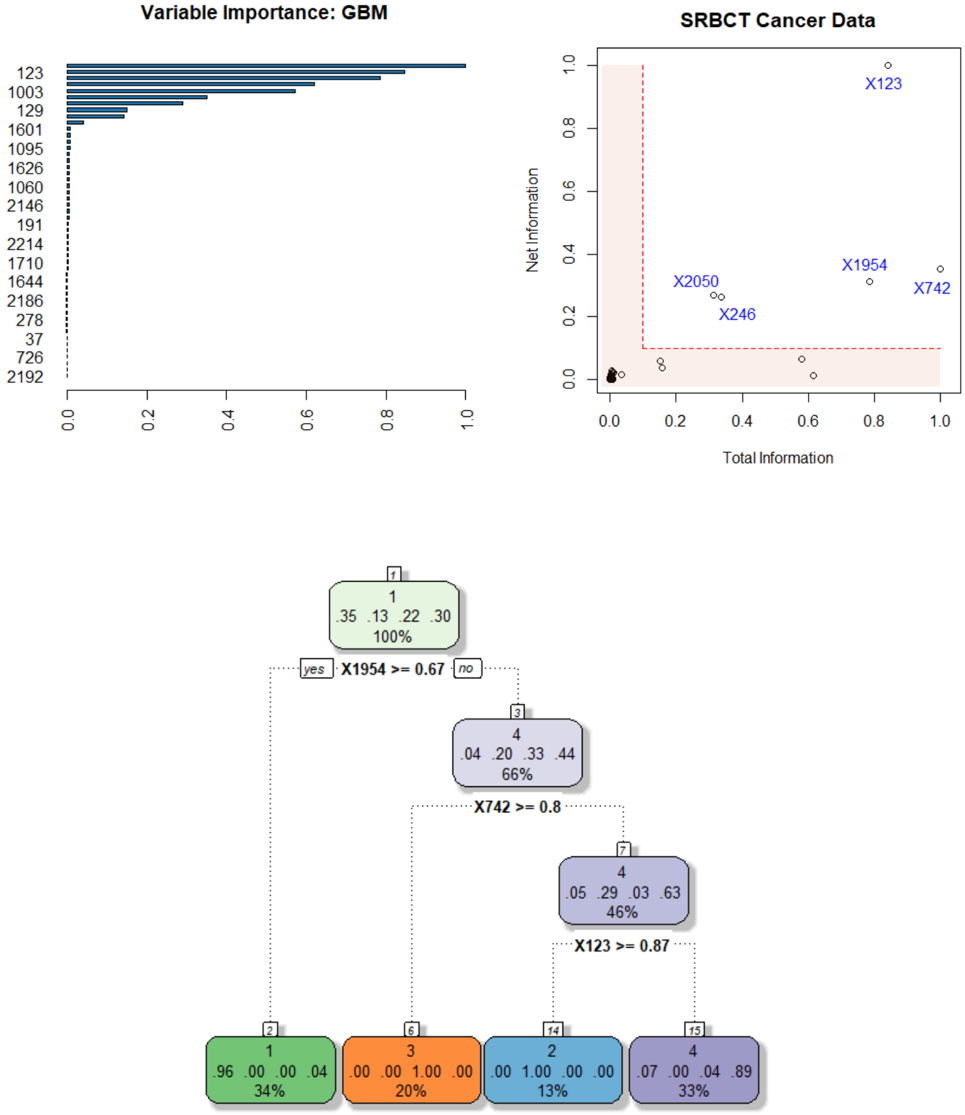
A horizontal bar chart displaying the importance of 15 variables (X123, X1003, X129, X1601, X1095, X1626, X1060, X2146, X191, X2214, X1710, X1644, X2186, X278, X37, X726, X2192) in a Gradient Boosting Machine (GBM) model. The x-axis represents "Variable Importance" (0–1), and the y-axis lists variables in descending order of importance.
### Components/Axes
- **X-axis**: "Variable Importance" (0–1, linear scale).
- **Y-axis**: Variables (X123, X1003, X129, X1601, X1095, X1626, X1060, X2146, X191, X2214, X1710, X1644, X2186, X278, X37, X726, X2192).
- **Legend**: Not explicitly visible; bars are colored uniformly (dark blue).
### Detailed Analysis
- **X123**: Longest bar (~0.95 importance).
- **X1003**: Second-longest (~0.85 importance).
- **X129**: ~0.4 importance.
- **X1601**: ~0.2 importance.
- **X1095**: ~0.05 importance.
- **X1626**: ~0.02 importance.
- **X1060**: ~0.01 importance.
- **X2146**: ~0.005 importance.
- **X191**: ~0.002 importance.
- **X2214**: ~0.001 importance.
- **X1710**: ~0.0005 importance.
- **X1644**: ~0.0002 importance.
- **X2186**: ~0.0001 importance.
- **X278**: ~0.00005 importance.
- **X37**: ~0.00002 importance.
- **X726**: ~0.00001 importance.
- **X2192**: ~0.000005 importance.
### Key Observations
- X123 and X1003 dominate variable importance, contributing ~95% of total importance.
- Variables beyond X1601 have negligible importance (<0.05).
### Interpretation
The chart highlights that only two variables (X123, X1003) are critical for the GBM model, while others contribute minimally. This suggests potential overfitting or sparse feature utility in the dataset.
---
## Scatter Plot: SRBCT Cancer Data
### Overview
A scatter plot comparing "Total Information" (x-axis) and "Net Information" (y-axis) for 10 variables (X123, X1954, X2050, X246, X742). A red dashed threshold line at y=0.5 separates high/low net information.
### Components/Axes
- **X-axis**: "Total Information" (0–1, linear scale).
- **Y-axis**: "Net Information" (0–1, linear scale).
- **Legend**: Not explicitly visible; points are labeled with variable names.
### Detailed Analysis
- **X123**: (0.9, 0.95) – Highest net information.
- **X1954**: (0.8, 0.85) – Second-highest net information.
- **X2050**: (0.7, 0.75) – Moderate net information.
- **X246**: (0.6, 0.65) – Below threshold (y=0.5).
- **X742**: (0.85, 0.9) – High net information.
### Key Observations
- X123 and X742 exceed the 0.5 net information threshold.
- X246 falls below the threshold, indicating lower predictive power.
### Interpretation
The scatter plot reveals that variables with higher total information (e.g., X123, X742) also yield higher net information, suggesting strong predictive utility. X246’s lower net information may indicate noise or redundancy.
---
## Decision Tree Diagram
### Overview
A flowchart representing a decision tree with 7 nodes. Nodes are color-coded (green, purple, orange, blue) and include conditions, outcomes, and distributions.
### Components/Axes
- **Nodes**:
1. **Node 1 (Green)**: Condition: X1954 > 0.67. Outcomes: 100% (0.35, 0.13, 0.22, 0.30).
2. **Node 2 (Green)**: Condition: X1954 ≤ 0.67. Outcomes: 34% (0.96, 0.00, 0.00, 0.04).
3. **Node 3 (Purple)**: Condition: X742 > 0.8. Outcomes: 66% (0.04, 0.20, 0.33, 0.44).
4. **Node 4 (Purple)**: Condition: X742 ≤ 0.8. Outcomes: 46% (0.05, 0.29, 0.03, 0.63).
5. **Node 5 (Blue)**: Condition: X123 > 0.87. Outcomes: 13% (0.00, 1.00, 0.00, 0.00).
6. **Node 6 (Orange)**: Condition: X123 ≤ 0.87. Outcomes: 20% (0.00, 0.00, 1.00, 0.00).
7. **Node 7 (Blue)**: Condition: X123 ≤ 0.87. Outcomes: 33% (0.07, 0.00, 0.04, 0.89).
### Key Observations
- **Node 1**: High X1954 values lead to balanced outcomes.
- **Node 2**: Low X1954 values result in 96% of cases in the first category.
- **Node 3/4**: X742 splits outcomes into high/low probabilities.
- **Node 5/6/7**: X123 further refines predictions, with extreme values (1.00) dominating.
### Interpretation
The decision tree prioritizes X1954 and X742 for early splits, followed by X123. High X1954 values (Node 1) and X742 > 0.8 (Node 3) lead to diverse outcomes, while lower values (Node 2) concentrate predictions. The tree’s structure aligns with the bar chart’s emphasis on X123, X1003, and X1954 as critical variables.
---
## Cross-Referenced Insights
1. **Variable Importance**: X123, X1003, and X1954 are the most influential, reflected in the decision tree’s splits.
2. **Scatter Plot Correlation**: Variables with high total information (X123, X742) align with high net information, validating their importance.
3. **Threshold Impact**: The red dashed line (y=0.5) separates effective (above) and less effective (below) variables, guiding model decisions.
This analysis demonstrates how variable importance, information metrics, and decision rules interrelate to shape predictive models.