## Line Chart: Similarity of Reasoning Steps
### Overview
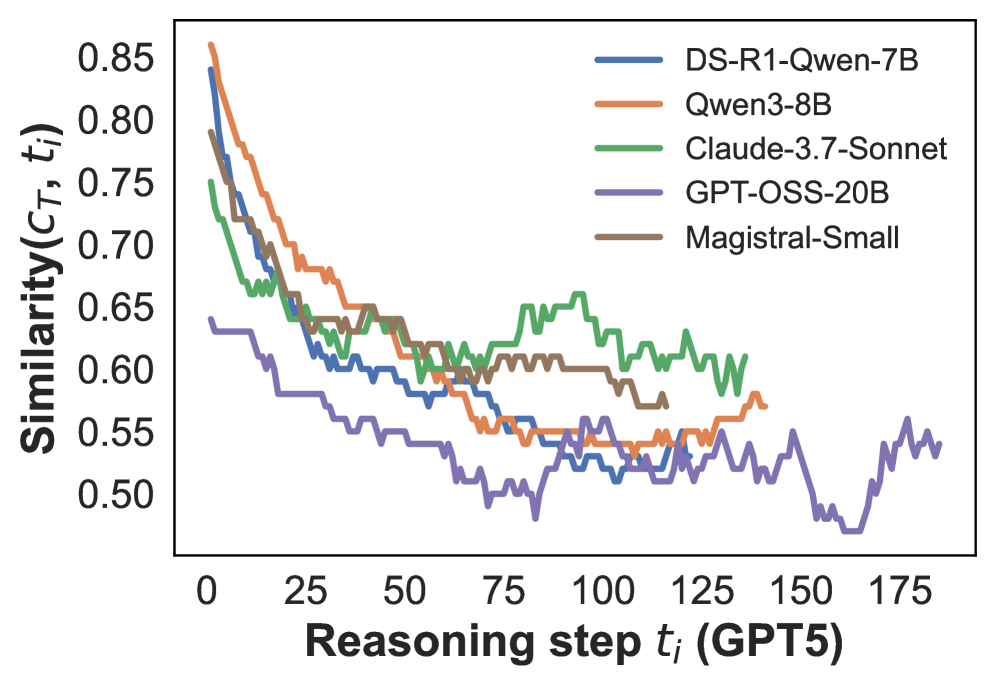
This line chart depicts the similarity (Similarity(Cτ, t)) between reasoning steps over a range of steps (0 to 175) for five different language models: DS-R1-Qwen-7B, Qwen3-8B, Claude-3.7-Sonnet, GPT-OSS-20B, and Magistral-Small. The chart illustrates how the similarity changes as the reasoning process progresses.
### Components/Axes
* **X-axis:** Reasoning step tᵢ (GPT5), ranging from 0 to approximately 175.
* **Y-axis:** Similarity(Cτ, t), ranging from 0.50 to 0.85.
* **Legend:** Located in the top-right corner, identifying each line with its corresponding model name and size.
* DS-R1-Qwen-7B (Blue)
* Qwen3-8B (Orange)
* Claude-3.7-Sonnet (Green)
* GPT-OSS-20B (Purple)
* Magistral-Small (Brown)
### Detailed Analysis
Here's a breakdown of each line's trend and approximate data points:
* **DS-R1-Qwen-7B (Blue):** The line starts at approximately 0.83 at step 0 and decreases rapidly to around 0.60 by step 25. It then fluctuates between approximately 0.58 and 0.65 until step 150, after which it shows a slight increase, ending at approximately 0.62 at step 175.
* **Qwen3-8B (Orange):** This line begins at approximately 0.81 at step 0 and declines to around 0.63 by step 25. It continues to decrease, reaching a low of approximately 0.55 around step 75. It then fluctuates between approximately 0.55 and 0.62 until step 175, ending at approximately 0.58.
* **Claude-3.7-Sonnet (Green):** Starting at approximately 0.80 at step 0, this line decreases to around 0.67 by step 25. It remains relatively stable, fluctuating between approximately 0.63 and 0.68 from step 50 to step 175, ending at approximately 0.65.
* **GPT-OSS-20B (Purple):** This line starts at approximately 0.66 at step 0 and decreases steadily to around 0.54 by step 50. It continues to decline, reaching a minimum of approximately 0.50 around step 150. It then shows a slight increase, ending at approximately 0.53 at step 175.
* **Magistral-Small (Brown):** Beginning at approximately 0.78 at step 0, this line decreases to around 0.63 by step 25. It fluctuates between approximately 0.60 and 0.67 from step 50 to step 175, ending at approximately 0.63.
### Key Observations
* All models exhibit a decreasing trend in similarity during the initial reasoning steps (0-25).
* Claude-3.7-Sonnet maintains the highest similarity scores throughout the reasoning process, with relatively low fluctuation.
* GPT-OSS-20B consistently shows the lowest similarity scores, and experiences the most significant decline.
* DS-R1-Qwen-7B, Qwen3-8B, and Magistral-Small show similar patterns of decline and fluctuation, with Qwen3-8B generally exhibiting slightly lower similarity than the other two.
### Interpretation
The chart suggests that as the reasoning process progresses, the consistency or similarity of the reasoning steps decreases for all the evaluated language models. This could indicate that the models diverge in their thought processes as they tackle more complex reasoning tasks. The relatively stable high similarity of Claude-3.7-Sonnet might suggest a more consistent and focused reasoning approach compared to the other models. The lower similarity and greater decline observed in GPT-OSS-20B could indicate a more exploratory or less focused reasoning process. The initial high similarity across all models suggests that they start with a similar understanding of the problem, but their approaches diverge as they proceed. The fluctuations in similarity for most models could represent moments of insight, correction, or exploration within the reasoning process. The data suggests that the model architecture and size play a role in the consistency of reasoning, with larger models not necessarily exhibiting more consistent reasoning.