## Bar Charts: HumanEvalFix Performance Across Languages
### Overview
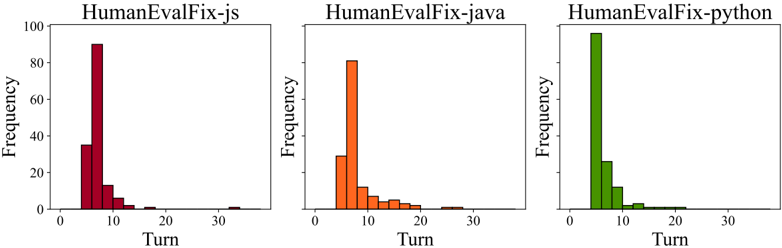
The image displays three bar charts comparing the frequency of "Turns" across three programming languages: JavaScript (red), Java (orange), and Python (green). Each chart represents a different language's performance in the HumanEvalFix framework, with frequency measured on the y-axis (0–100) and turn numbers on the x-axis (0–30).
### Components/Axes
- **X-axis (Turn)**: Discrete intervals at 0, 5, 10, 15, 20, 25, 30.
- **Y-axis (Frequency)**: Linear scale from 0 to 100.
- **Legends**:
- Red = HumanEvalFix-js
- Orange = HumanEvalFix-java
- Green = HumanEvalFix-python
### Detailed Analysis
#### HumanEvalFix-js (Red)
- **Turn 5**: ~35 frequency
- **Turn 10**: ~90 frequency (peak)
- **Turn 15**: ~5 frequency
- **Turn 20**: ~2 frequency
- **Trend**: Sharp peak at turn 10, rapid decline afterward.
#### HumanEvalFix-java (Orange)
- **Turn 5**: ~30 frequency
- **Turn 10**: ~80 frequency (peak)
- **Turn 15**: ~5 frequency
- **Turn 20**: ~2 frequency
- **Trend**: Moderate peak at turn 10, gradual decline.
#### HumanEvalFix-python (Green)
- **Turn 5**: ~100 frequency (peak)
- **Turn 10**: ~25 frequency
- **Turn 15**: ~5 frequency
- **Turn 20**: ~2 frequency
- **Trend**: Highest initial peak at turn 5, steep drop-off.
### Key Observations
1. **Peak Frequency**:
- Python shows the highest frequency at turn 5 (~100), followed by JavaScript (~90 at turn 10) and Java (~80 at turn 10).
2. **Decline Pattern**: All languages exhibit a sharp drop in frequency after their peak turn, with minimal activity beyond turn 20.
3. **Turn 10 Disparity**: JavaScript and Java have significantly higher frequencies at turn 10 compared to Python (~90 vs. ~25).
### Interpretation
The data suggests that **Python** prioritizes early-stage problem resolution (peak at turn 5), while **JavaScript** and **Java** focus more on mid-stage turns (turn 10). The rapid decline across all languages implies diminishing returns or resolution efficiency after initial turns. JavaScript’s peak at turn 10 may indicate delayed issue identification or iterative debugging, whereas Python’s early resolution could reflect streamlined debugging processes. The uniformity in post-peak decline highlights a potential bottleneck in later stages of the HumanEvalFix workflow.