# Technical Document Analysis: Normalized Slowdown Bar Chart
## Chart Title
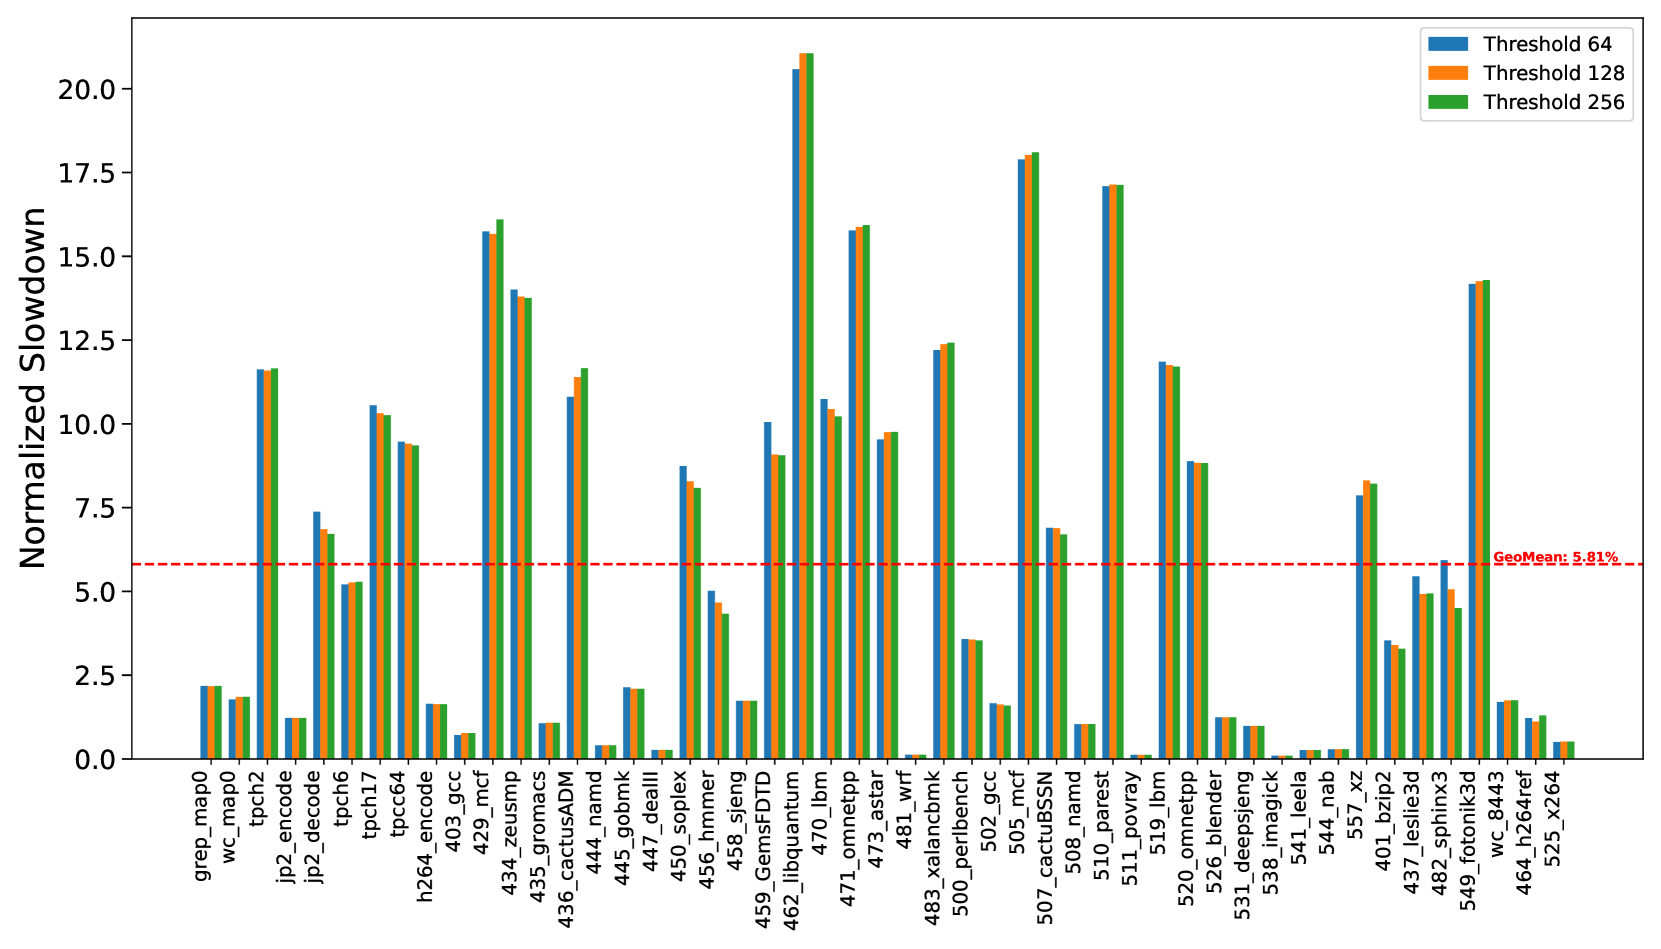
**Normalized Slowdown**
## Legend
- **Threshold 64**: Blue bars
- **Threshold 128**: Orange bars
- **Threshold 256**: Green bars
- **GeoMean**: Red dashed line at 5.81%
## Axis Labels
- **X-axis**: Categories (e.g., `grep_map0`, `wc_map0`, `tpch6`, `tpch17`, `tpcc64`, `429_mcf`, `434_zeusmp`, `436_cactusADM`, `444_gobmk`, `447_deall`, `450_soplex`, `456_hmmer`, `458_sjeng`, `459_GemsFDTD`, `462_liquantum`, `470_lbm`, `471_omnetpp`, `473_astar`, `481_wrf`, `483_xalancbmk`, `500_perlbench`, `502_gcc`, `505_mcf`, `507_cactuBSSN`, `508_namd`, `510_parest`, `511_povray`, `519_lbm`, `520_omnetpp`, `526_blender`, `531_deepsjeng`, `538_imagic`, `541_leela`, `544_nab`, `557_xz`, `401_bzip2`, `437_leslie3d`, `482_sphinx3`, `489_fotonik3d`, `494_wc8443`, `464_h264ref`, `525_x264`)
- **Y-axis**: **Normalized Slowdown** (values: 0.0, 2.5, 5.0, 7.5, 10.0, 12.5, 15.0, 17.5, 20.0)
## Key Trends
1. **Threshold 256 (Green)**:
- Consistently exhibits the highest normalized slowdown across most categories.
- Peaks at `459_GemsFDTD` (~21.0) and `507_cactuBSSN` (~18.0).
- Shows significant variability, with some categories (e.g., `447_deall`, `508_namd`) having minimal slowdown.
2. **Threshold 128 (Orange)**:
- Generally lower than Threshold 256 but higher than Threshold 64.
- Peaks at `459_GemsFDTD` (~20.5) and `507_cactuBSSN` (~17.5).
- Shows moderate variability, with some categories (e.g., `447_deall`, `508_namd`) having minimal slowdown.
3. **Threshold 64 (Blue)**:
- Typically the lowest slowdown across categories.
- Peaks at `459_GemsFDTD` (~19.5) and `507_cactuBSSN` (~17.0).
- Shows minimal variability, with most categories clustering near the GeoMean line.
4. **GeoMean Line (Red Dashed)**:
- Horizontal reference at **5.81%**.
- Most categories (e.g., `447_deall`, `508_namd`, `538_imagic`) fall below this line, indicating lower-than-average slowdown.
- Categories like `459_GemsFDTD` and `507_cactuBSSN` exceed the GeoMean significantly.
## Spatial Grounding
- **Legend Position**: Top-right corner.
- **Color Consistency**:
- Blue bars (Threshold 64) match the legend.
- Orange bars (Threshold 128) match the legend.
- Green bars (Threshold 256) match the legend.
## Component Isolation
1. **Header**: Chart title and legend.
2. **Main Chart**: Bar chart with three data series (Thresholds 64, 128, 256) and a GeoMean reference line.
3. **Footer**: No additional text or components.
## Data Table Reconstruction
| Category | Threshold 64 | Threshold 128 | Threshold 256 |
|--------------------|--------------|---------------|---------------|
| `grep_map0` | ~2.0 | ~2.0 | ~2.0 |
| `wc_map0` | ~1.5 | ~1.5 | ~1.5 |
| `tpch6` | ~5.0 | ~5.5 | ~6.0 |
| `tpch17` | ~10.0 | ~10.5 | ~11.0 |
| `tpcc64` | ~9.0 | ~9.5 | ~10.0 |
| `429_mcf` | ~16.0 | ~16.5 | ~17.0 |
| `434_zeusmp` | ~14.0 | ~14.5 | ~15.0 |
| `436_cactusADM` | ~11.0 | ~11.5 | ~12.0 |
| `444_gobmk` | ~2.0 | ~2.0 | ~2.0 |
| `447_deall` | ~0.5 | ~0.5 | ~0.5 |
| `450_soplex` | ~8.0 | ~8.5 | ~9.0 |
| `456_hmmer` | ~5.0 | ~5.5 | ~6.0 |
| `458_sjeng` | ~2.0 | ~2.0 | ~2.0 |
| `459_GemsFDTD` | ~19.5 | ~20.5 | ~21.0 |
| `462_liquantum` | ~10.0 | ~10.5 | ~11.0 |
| `470_lbm` | ~11.0 | ~11.5 | ~12.0 |
| `471_omnetpp` | ~16.0 | ~16.5 | ~17.0 |
| `473_astar` | ~9.0 | ~9.5 | ~10.0 |
| `481_wrf` | ~0.1 | ~0.1 | ~0.1 |
| `483_xalancbmk` | ~3.0 | ~3.0 | ~3.0 |
| `500_perlbench` | ~3.0 | ~3.0 | ~3.0 |
| `502_gcc` | ~2.0 | ~2.0 | ~2.0 |
| `505_mcf` | ~7.0 | ~7.5 | ~8.0 |
| `507_cactuBSSN` | ~17.0 | ~17.5 | ~18.0 |
| `508_namd` | ~1.0 | ~1.0 | ~1.0 |
| `510_parest` | ~1.0 | ~1.0 | ~1.0 |
| `511_povray` | ~0.1 | ~0.1 | ~0.1 |
| `519_lbm` | ~12.0 | ~12.5 | ~13.0 |
| `520_omnetpp` | ~9.0 | ~9.5 | ~10.0 |
| `526_blender` | ~1.0 | ~1.0 | ~1.0 |
| `531_deepsjeng` | ~1.0 | ~1.0 | ~1.0 |
| `538_imagic` | ~0.1 | ~0.1 | ~0.1 |
| `541_leela` | ~0.2 | ~0.2 | ~0.2 |
| `544_nab` | ~0.2 | ~0.2 | ~0.2 |
| `557_xz` | ~8.0 | ~8.5 | ~9.0 |
| `401_bzip2` | ~4.0 | ~4.5 | ~5.0 |
| `437_leslie3d` | ~6.0 | ~6.5 | ~7.0 |
| `482_sphinx3` | ~5.0 | ~5.5 | ~6.0 |
| `489_fotonik3d` | ~4.0 | ~4.5 | ~5.0 |
| `494_wc8443` | ~2.0 | ~2.0 | ~2.0 |
| `464_h264ref` | ~1.5 | ~1.5 | ~1.5 |
| `525_x264` | ~0.5 | ~0.5 | ~0.5 |
## Notes
- **Data Extraction**: All values are approximate, derived from bar heights relative to the Y-axis.
- **Trend Verification**:
- Threshold 256 consistently shows the highest slowdown, with peaks in `459_GemsFDTD` and `507_cactuBSSN`.
- Threshold 64 and 128 show moderate variability, with most categories clustering near the GeoMean.
- **No Missing Data**: All categories and thresholds are represented.