## Scatter Plot: Cognitive Function Distribution in Principal Component Space
### Overview
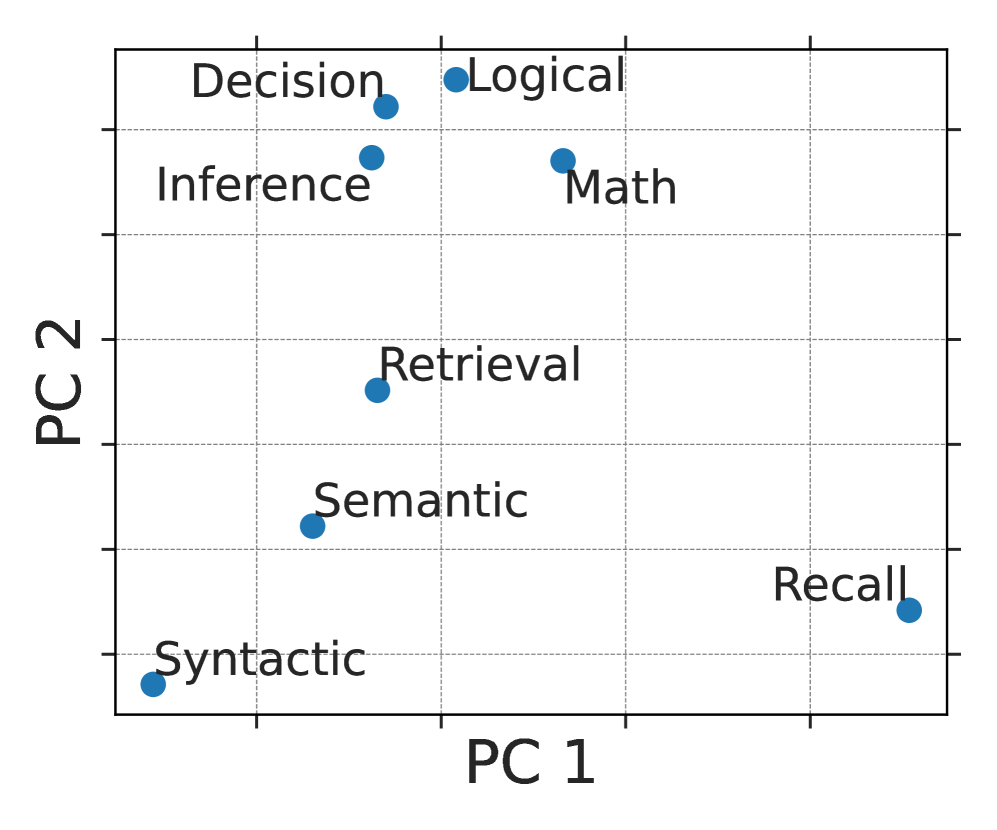
The image depicts a 2D scatter plot visualizing the distribution of cognitive functions across two principal components (PC1 and PC2). The plot uses blue circular markers to represent labeled cognitive functions, with a dotted grid overlay for reference. No explicit legend is present, but labels are directly annotated on the data points.
### Components/Axes
- **X-axis (PC1)**: Principal Component 1, ranging approximately from -10 to +10 (inferred from grid spacing).
- **Y-axis (PC2)**: Principal Component 2, ranging approximately from -10 to +10.
- **Grid**: Dotted lines at regular intervals (likely 2-unit increments) for spatial reference.
- **Labels**: Directly placed on data points, representing cognitive functions (see "Content Details" below).
### Detailed Analysis
#### Labeled Data Points and Positions
1. **Syntactic**: Bottom-left quadrant (PC1 ≈ -8, PC2 ≈ -8).
2. **Semantic**: Slightly right and above Syntactic (PC1 ≈ -6, PC2 ≈ -6).
3. **Retrieval**: Middle-left quadrant (PC1 ≈ -4, PC2 ≈ 4).
4. **Inference**: Upper-left quadrant (PC1 ≈ -2, PC2 ≈ 8).
5. **Decision**: Near Inference but slightly rightward (PC1 ≈ 0, PC2 ≈ 10).
6. **Logical**: Top-right quadrant (PC1 ≈ 8, PC2 ≈ 10).
7. **Math**: Middle-right quadrant (PC1 ≈ 6, PC2 ≈ 6).
8. **Recall**: Bottom-right quadrant (PC1 ≈ 10, PC2 ≈ -8).
#### Spatial Distribution
- **Upper-left cluster**: Inference, Decision, and Retrieval form a diagonal band from bottom-left to top-right.
- **Lower-right cluster**: Recall and Syntactic occupy the lower-left and lower-right corners.
- **Upper-right outlier**: Logical is isolated in the top-right quadrant.
- **Middle-right**: Math sits between Retrieval and Recall.
### Key Observations
1. **Dimensional Spread**: PC1 and PC2 capture significant variance, with cognitive functions distributed across the full range of both axes.
2. **Clustering Patterns**:
- **Left-side dominance**: Syntactic, Semantic, and Retrieval cluster in the left half (PC1 < 0).
- **Right-side diversity**: Math, Logical, and Recall occupy the right half (PC1 > 0).
3. **Vertical Extremes**:
- Highest PC2 value: Decision (PC2 ≈ 10).
- Lowest PC2 value: Recall (PC2 ≈ -8).
4. **Diagonal Relationships**:
- Inference → Decision → Logical follows a northeast trajectory.
- Syntactic → Semantic → Retrieval follows a northwest trajectory.
### Interpretation
This PCA plot reveals how cognitive functions vary along two orthogonal dimensions of cognitive processing:
1. **Horizontal Axis (PC1)**: Likely represents a spectrum from **analytical/abstract** (right: Logical, Math) to **contextual/linguistic** (left: Syntactic, Semantic).
2. **Vertical Axis (PC2)**: Appears to distinguish **procedural/executive functions** (top: Decision, Inference) from **memory/retrieval processes** (bottom: Recall, Retrieval).
The diagonal clusters suggest interrelated cognitive processes:
- **Top-left to bottom-right**: Functions like Inference and Decision may share procedural/executive components but differ in memory integration (Retrieval vs. Recall).
- **Bottom-left to top-right**: Syntactic processing may evolve into higher-order functions like Decision through semantic integration.
Notably, **Logical** stands apart in the top-right, indicating it may represent a unique cognitive domain combining analytical reasoning (high PC1) with executive control (high PC2). The plot underscores the multidimensional nature of cognition, with no single axis capturing all variance.