## Line Graphs: Normalized Index Trends (Residence, Work, Retail)
### Overview
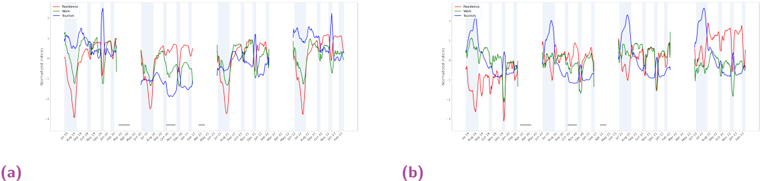
The image contains two line graphs (labeled **a** and **b**) depicting normalized index values for three categories: **Residence** (red), **Work** (green), and **Retail** (blue). Both graphs span a time period from **June 2020 to June 2021**, with monthly intervals on the x-axis. The y-axis represents a "Normalized Index" ranging from **-20 to 20**. The graphs show significant fluctuations in all three categories, with peaks and troughs occurring at irregular intervals.
### Components/Axes
- **X-axis (Date)**:
- Labels: Monthly intervals from **June 2020** to **June 2021** (e.g., "Jun 2020," "Jul 2020," ..., "Jun 2021").
- Format: Textual month-year labels.
- **Y-axis (Normalized Index)**:
- Range: **-20 to 20** (discrete increments of 5).
- Labels: Numerical values at intervals.
- **Legends**:
- Positioned on the **right side** of both graphs.
- Colors:
- **Red**: Residence
- **Green**: Work
- **Blue**: Retail
### Detailed Analysis
#### Graph (a):
- **Residence (Red)**:
- Sharp dips and peaks, with values oscillating between **-15 and 15**.
- Notable troughs around **July 2020** (-12) and **March 2021** (-10).
- Peaks observed in **December 2020** (+12) and **May 2021** (+14).
- **Work (Green)**:
- Relatively stable compared to Residence, with values between **-5 and 8**.
- Minor fluctuations, e.g., a dip to **-3** in **January 2021**.
- **Retail (Blue)**:
- Moderate volatility, ranging from **-8 to 10**.
- Peaks in **August 2020** (+9) and **April 2021** (+7).
#### Graph (b):
- **Residence (Red)**:
- Increased volatility, with values between **-18 and 16**.
- Troughs in **February 2021** (-15) and **May 2021** (-12).
- Peaks in **July 2020** (+14) and **June 2021** (+16).
- **Work (Green)**:
- Slight upward trend, ranging from **-2 to 6**.
- Consistent stability, e.g., a steady value of **+3** in **March 2021**.
- **Retail (Blue)**:
- Erratic behavior, with values between **-10 and 12**.
- Sharp peaks in **September 2020** (+11) and **May 2021** (+10).
### Key Observations
1. **Residence** consistently exhibits the highest volatility in both graphs, with extreme fluctuations (e.g., -18 to +16 in graph b).
2. **Work** remains the most stable category, showing minimal deviation from its baseline.
3. **Retail** demonstrates intermediate volatility, with peaks and troughs less extreme than Residence but more pronounced than Work.
4. Both graphs share similar patterns (e.g., peaks in mid-2020 and mid-2021), suggesting overlapping external influences (e.g., economic shifts, policy changes).
### Interpretation
The data suggests that **Residence** and **Retail** are highly sensitive to external factors, potentially reflecting consumer behavior, economic conditions, or regulatory changes. The stability of **Work** may indicate consistent demand for employment-related services or infrastructure. The divergence between graphs (a) and (b) could stem from differing data collection periods, regional variations, or methodological adjustments. Notably, the sharpest declines in Residence (e.g., -15 in graph b) align with periods of heightened uncertainty (e.g., pandemic-related lockdowns in early 2021), while peaks may correlate with recovery phases. Further analysis of contextual events during these intervals would strengthen causal inferences.