# Technical Document Extraction: Probability Distribution over the LLM's Text Tokens
## 1. Document Metadata
* **Title:** Probability Distribution over the LLM's Text Tokens
* **Type:** Line Chart / Probability Mass Function (PMF) visualization
* **Language:** English
## 2. Component Isolation
### Header
* **Text:** "Probability Distribution over the LLM's Text Tokens"
* **Position:** Top center.
### Main Chart Area
* **Y-Axis Label:** Probability
* **Y-Axis Scale:** Linear, ranging from 0.000 to 0.012 with major tick intervals of 0.002.
* **X-Axis Label:** Tokens Index
* **X-Axis Scale:** Linear, ranging from 0 to approximately 128,000 with major tick intervals of 20,000.
* **Data Series:** A single light-blue line plot representing the probability assigned to each token in a Large Language Model's vocabulary.
## 3. Data Extraction and Trend Analysis
### Axis Markers
| Axis | Markers / Ticks |
| :--- | :--- |
| **Y-Axis (Probability)** | 0.000, 0.002, 0.004, 0.006, 0.008, 0.010, 0.012 |
| **X-Axis (Tokens Index)** | 0, 20000, 40000, 60000, 80000, 100000, 120000 |
### Trend Verification
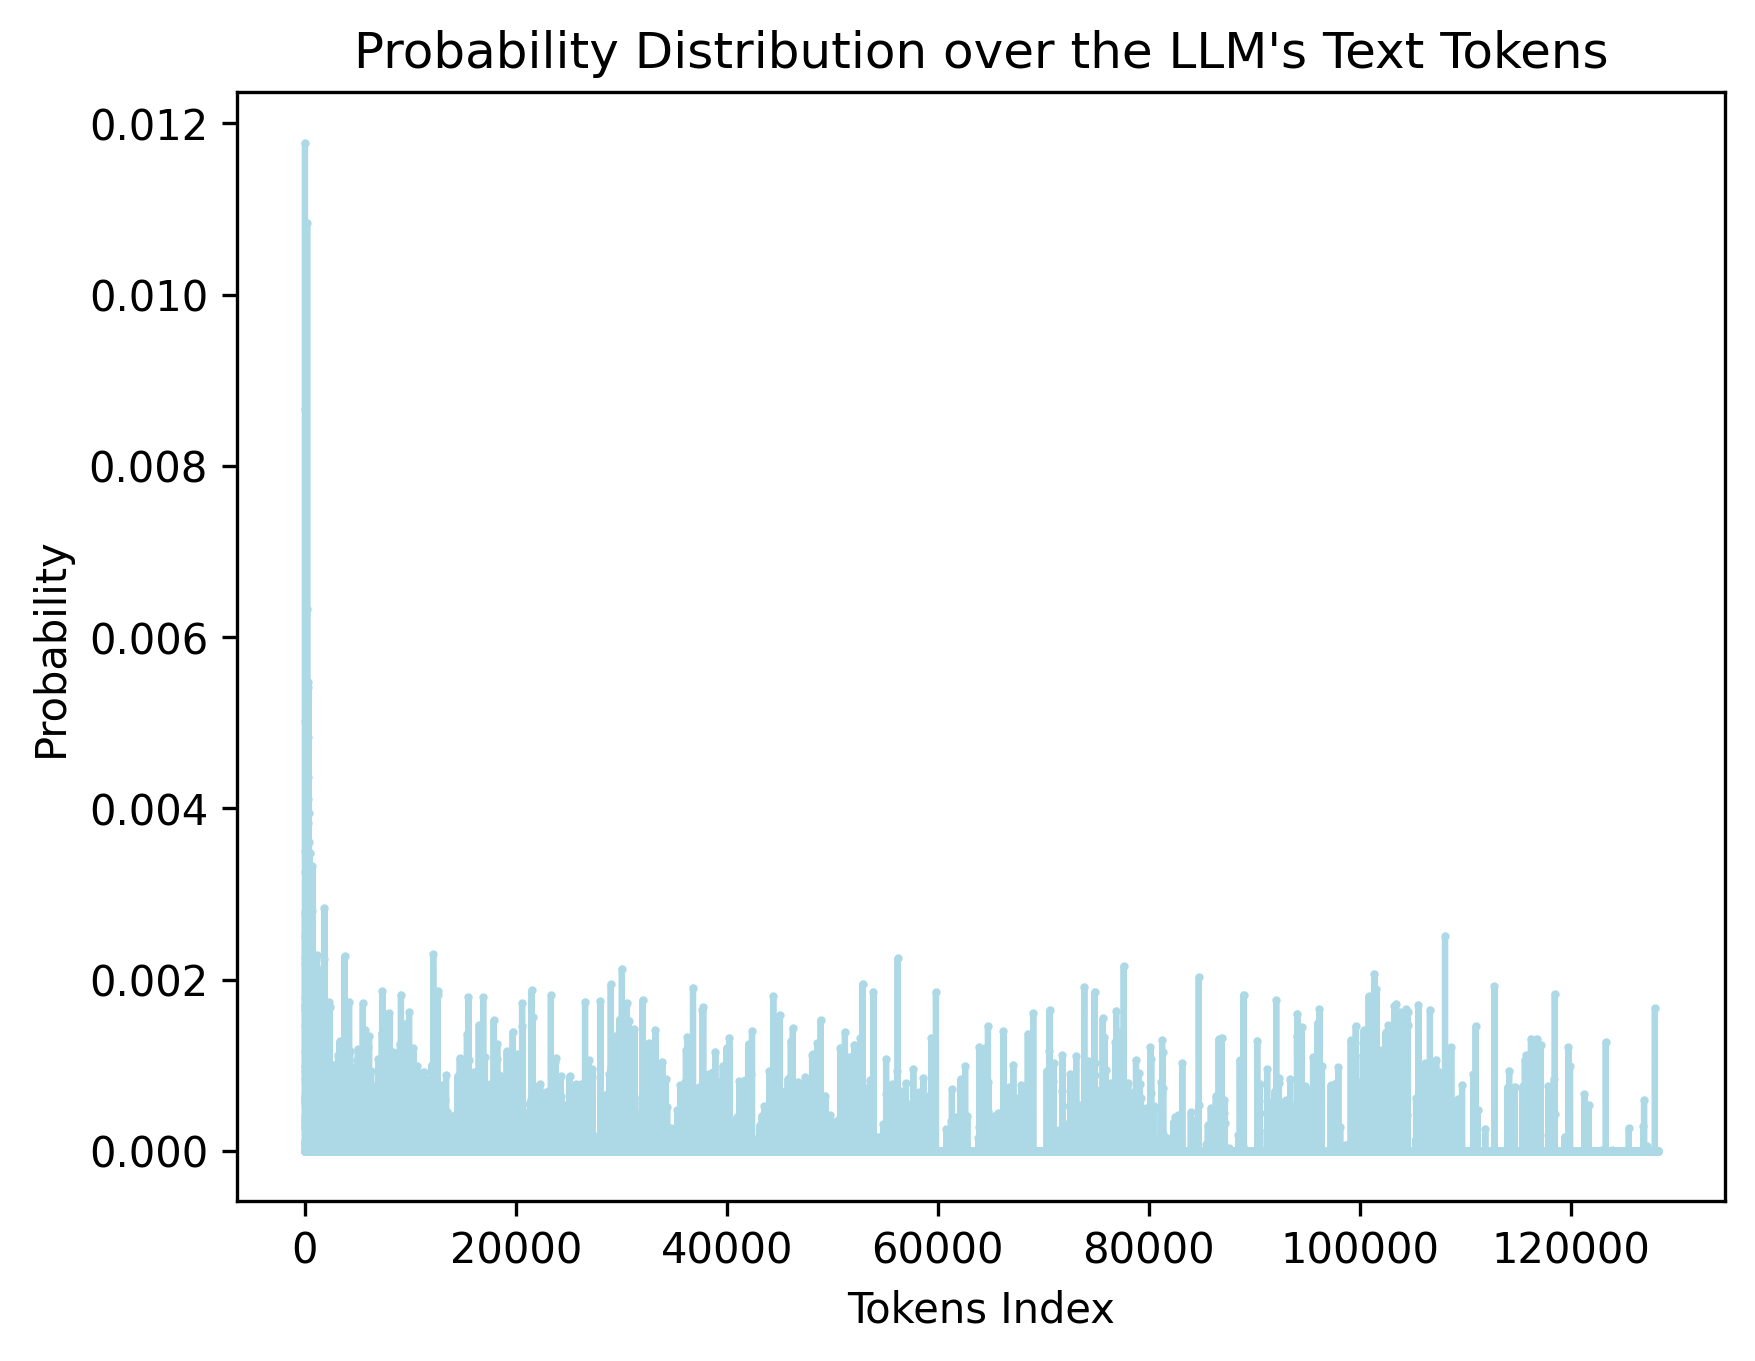
* **Initial Peak:** The data series begins with an extremely sharp vertical spike at the very beginning of the X-axis (Token Index near 0). This represents the "greedy" or most likely token.
* **Primary Trend:** Immediately following the initial spike, there is a precipitous drop-off. The probability values fall from nearly 0.012 to below 0.004 within the first few hundred indices.
* **Secondary Trend (Long Tail):** From Token Index ~5,000 to ~128,000, the distribution enters a "long tail." The baseline probability sits very close to 0.000, with frequent stochastic "spikes" or "noise" where individual tokens reach probabilities between 0.001 and 0.002.
* **Visual Density:** The density of the light-blue lines indicates a very large vocabulary (approx. 128k tokens), where the vast majority of tokens have a near-zero probability of being selected.
### Key Data Points (Estimated)
* **Maximum Probability:** ~0.0118 (at Token Index 0).
* **Secondary Peaks:** Several tokens throughout the vocabulary (e.g., near index 12,000, 30,000, 58,000, 78,000, and 108,000) show localized spikes reaching approximately 0.002 to 0.0025.
* **Vocabulary Limit:** The data series terminates just before the 140,000 mark, specifically around 128,000, which is a common vocabulary size for modern LLMs (e.g., Llama 3).
## 4. Technical Summary
This chart visualizes the softmax output (probability distribution) of a Large Language Model for a single prediction step. It demonstrates a **highly skewed distribution**. A very small number of tokens (the "head") carry significant probability mass, while the overwhelming majority of the 128,000+ tokens (the "long tail") have negligible individual probabilities. This visualization is characteristic of a model that has a clear preference for a specific next token but maintains a wide, low-probability field for alternative "creative" or "noisy" selections.