\n
## Line Chart: Probability Distribution over LLM's Text Tokens
### Overview
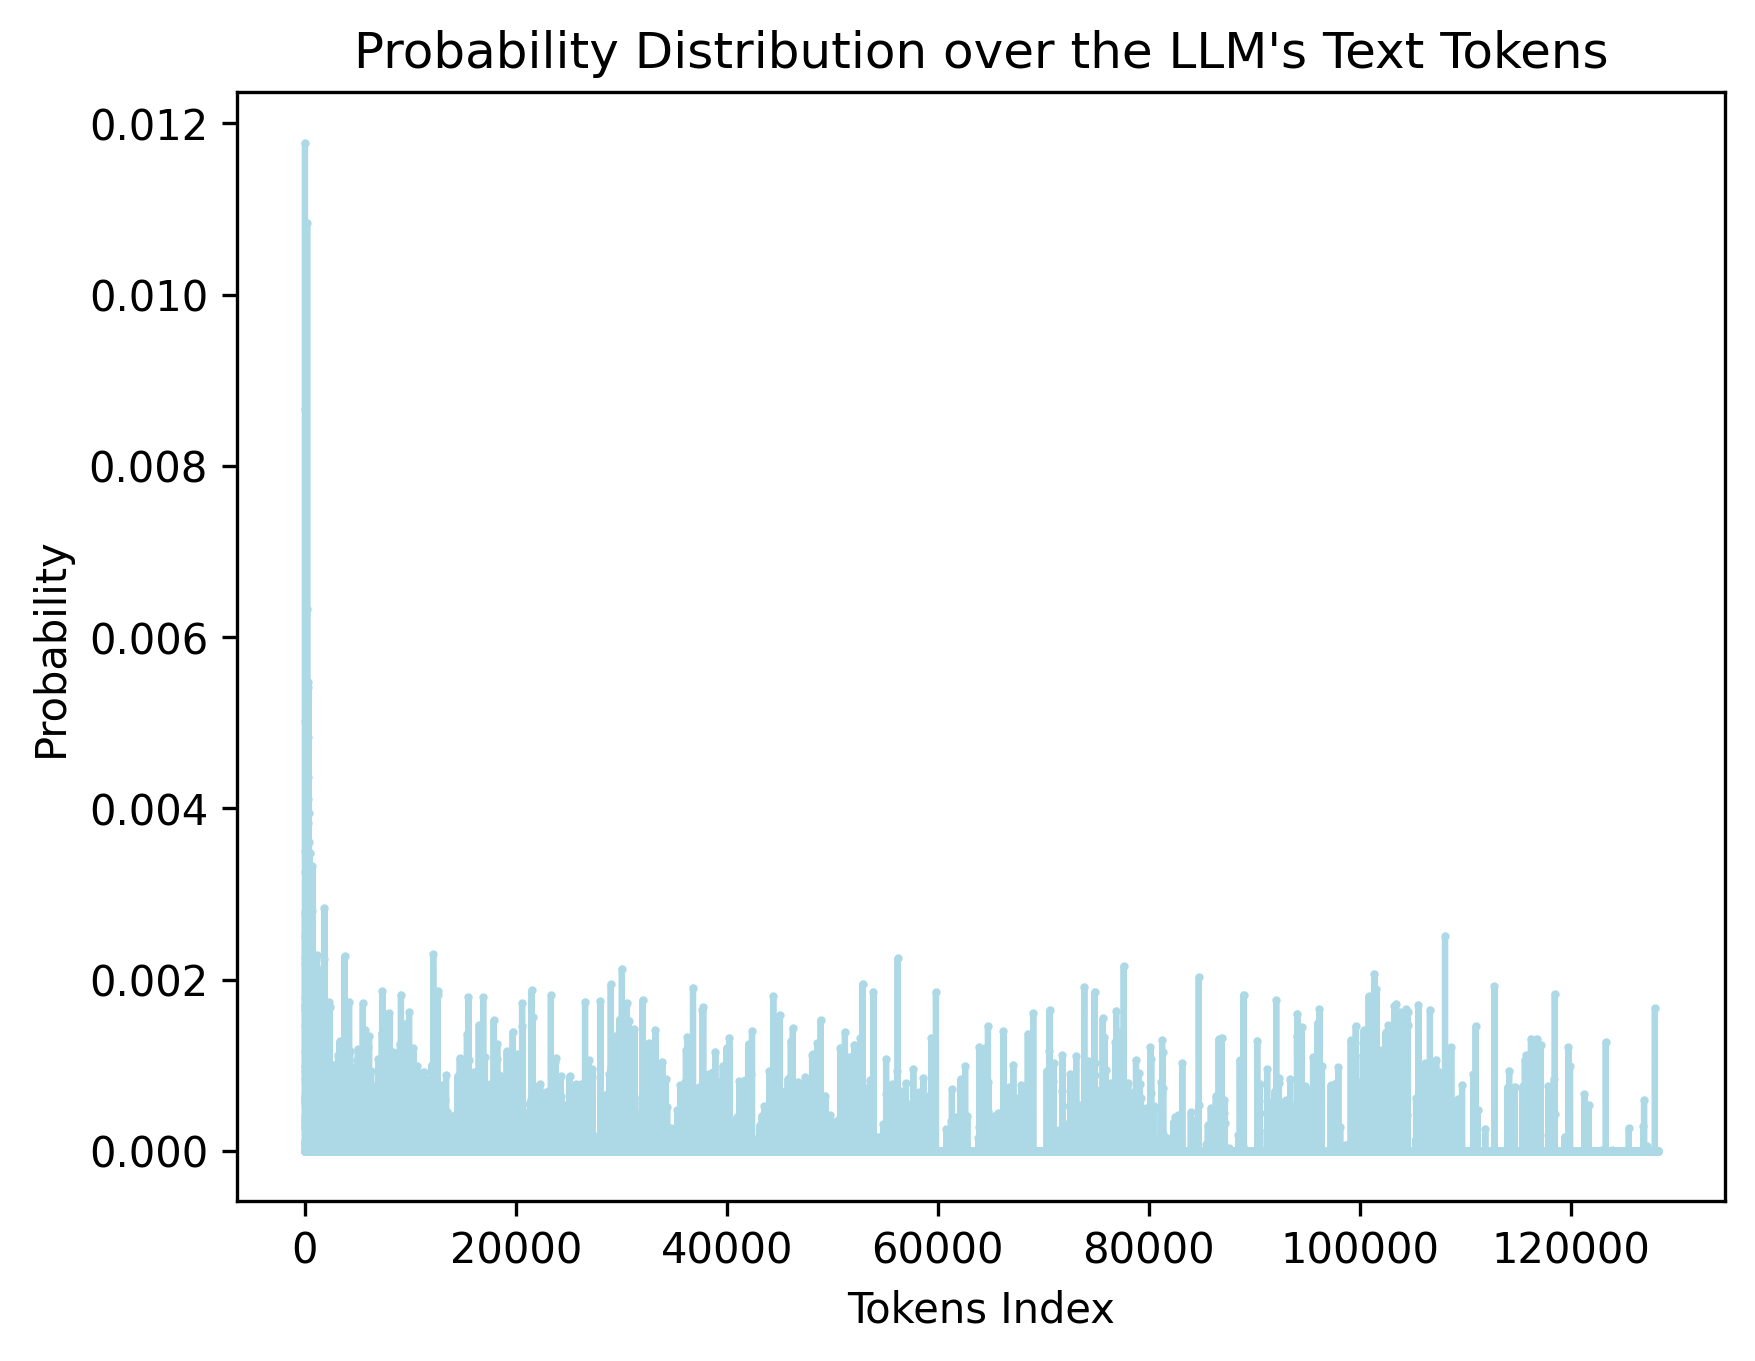
The image presents a line chart illustrating the probability distribution across the text tokens of a Large Language Model (LLM). The x-axis represents the token index, and the y-axis represents the probability. The chart shows a steep initial drop in probability followed by a relatively stable, fluctuating distribution for the remaining tokens.
### Components/Axes
* **Title:** "Probability Distribution over the LLM's Text Tokens" - positioned at the top-center of the chart.
* **X-axis Label:** "Tokens Index" - positioned at the bottom-center of the chart. The scale ranges from approximately 0 to 12000.
* **Y-axis Label:** "Probability" - positioned at the left-center of the chart. The scale ranges from approximately 0.000 to 0.012.
* **Data Series:** A single light-blue line representing the probability distribution.
* **No Legend:** There is no explicit legend present.
### Detailed Analysis
The line chart begins with a very high probability value at Token Index 0, approximately 0.0115. This value rapidly decreases to around 0.002 by Token Index 500. After this initial drop, the line fluctuates between approximately 0.000 and 0.002 for the remainder of the token indices (from 500 to 12000).
Here's a breakdown of approximate values at specific Token Indices:
* Token Index 0: Probability ≈ 0.0115
* Token Index 500: Probability ≈ 0.002
* Token Index 1000: Probability ≈ 0.0018
* Token Index 2000: Probability ≈ 0.0015
* Token Index 4000: Probability ≈ 0.0019
* Token Index 6000: Probability ≈ 0.0012
* Token Index 8000: Probability ≈ 0.0017
* Token Index 10000: Probability ≈ 0.0014
* Token Index 12000: Probability ≈ 0.0011
The line exhibits numerous small peaks and valleys throughout the range of 500 to 12000, indicating variations in token probability. The fluctuations appear somewhat random, with no clear upward or downward trend.
### Key Observations
* **Initial Peak:** The initial token (Index 0) has a significantly higher probability than all subsequent tokens.
* **Rapid Decay:** The probability decays rapidly within the first 500 tokens.
* **Stable Fluctuation:** After the initial decay, the probability remains relatively stable, fluctuating within a narrow range.
* **No Clear Trend:** There is no discernible long-term trend (upward or downward) in the probability distribution after the initial decay.
### Interpretation
This chart likely represents the probability distribution of tokens generated by a Large Language Model (LLM). The high initial probability suggests that the first token generated is highly predictable, potentially a start-of-sequence token or a common word. The rapid decay indicates that subsequent tokens become less predictable as the sequence progresses. The stable, fluctuating distribution for the remaining tokens suggests that the LLM has a relatively uniform probability of generating different tokens after the initial phase.
The lack of a clear trend in the later tokens could indicate that the LLM is generating a diverse range of tokens, or that the probability distribution is inherently noisy. The fluctuations might be due to the LLM's internal state, the context of the generated text, or the inherent randomness in the generation process.
The chart provides insights into the LLM's token generation behavior, highlighting the initial predictability and subsequent diversity of the generated text. It suggests that the LLM's output becomes less constrained as the sequence length increases.