\n
## Probability Distribution Chart: LLM Text Tokens
### Overview
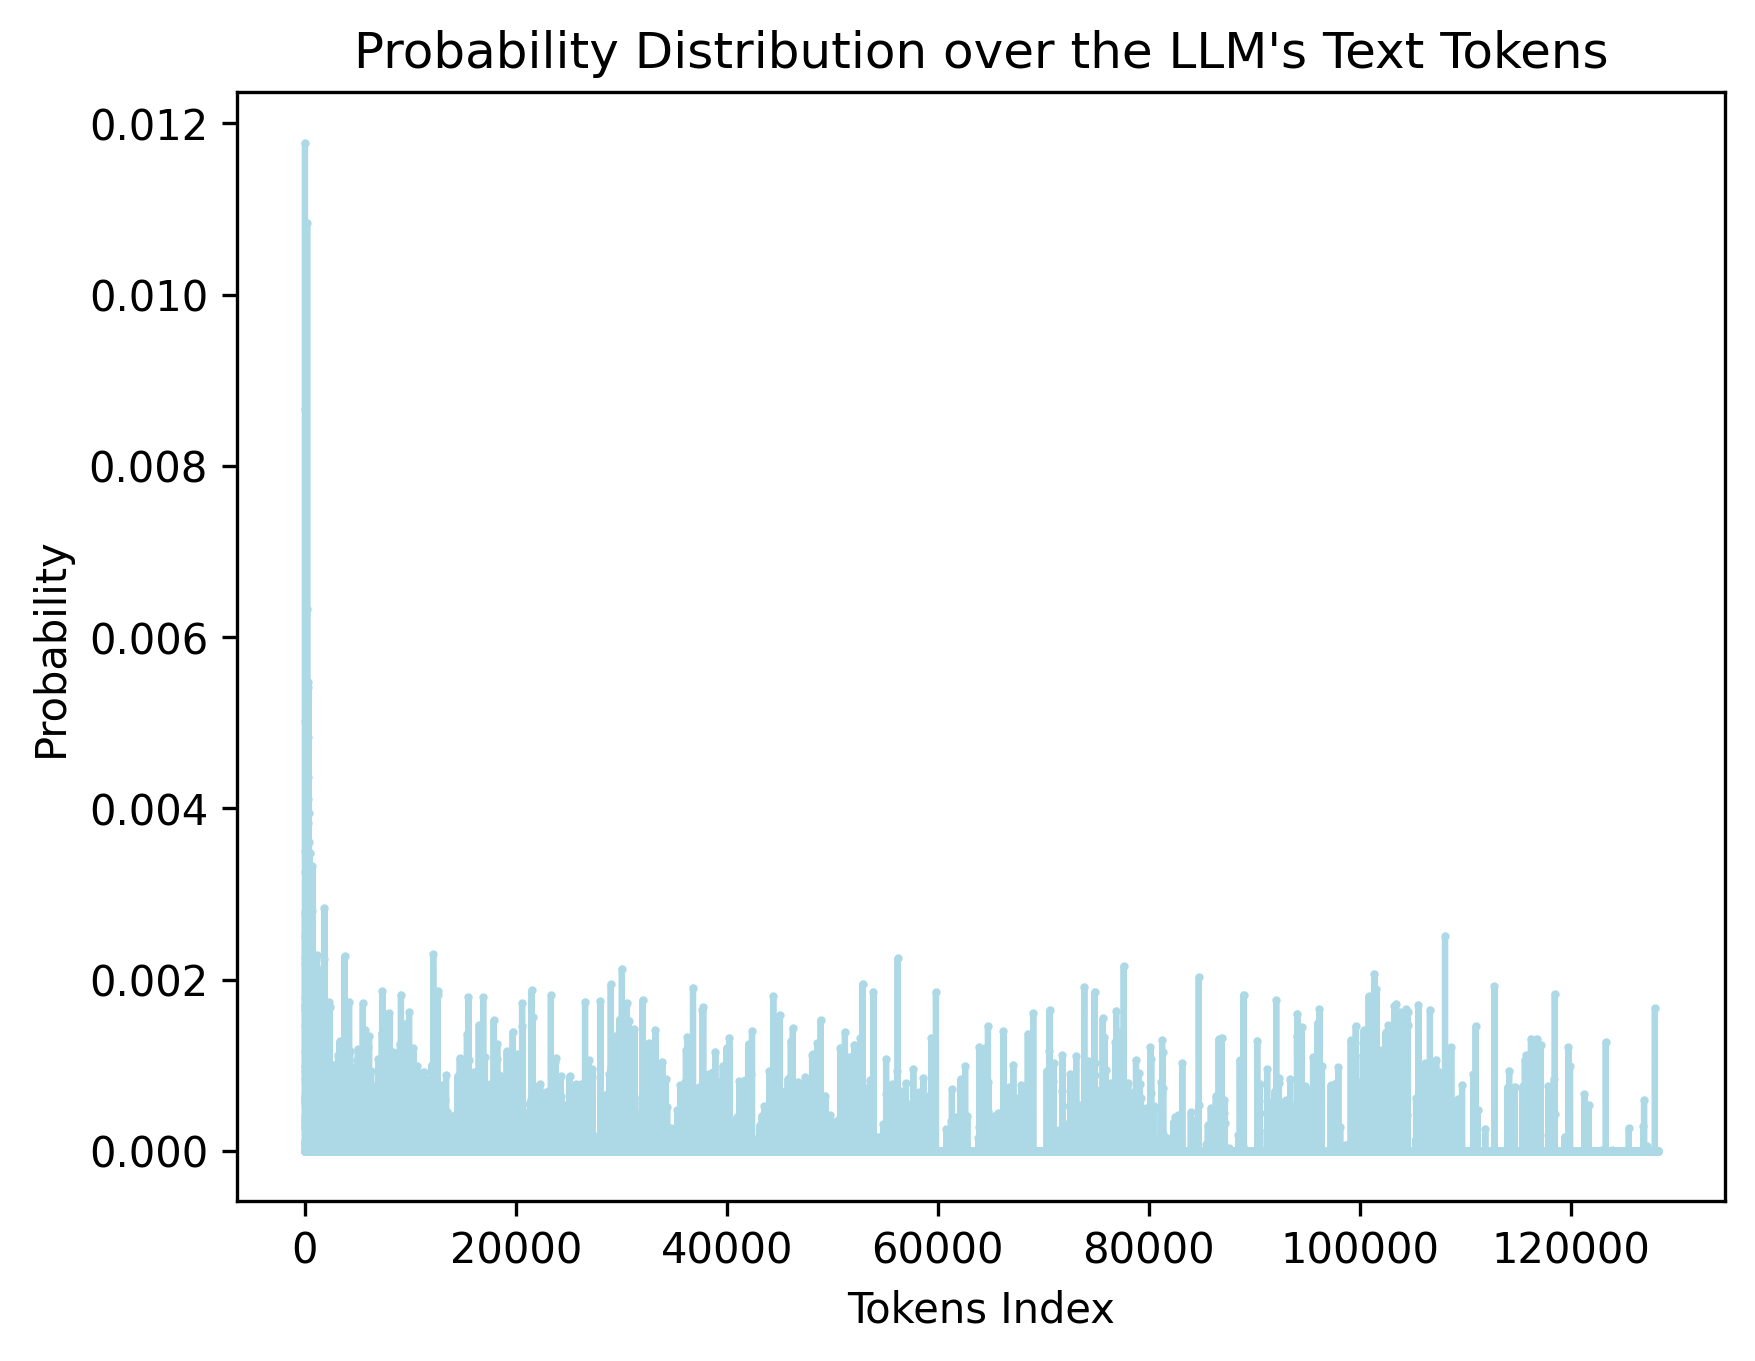
The image displays a bar chart titled "Probability Distribution over the LLM's Text Tokens." It visualizes the probability assigned to different tokens (indexed numerically) by a Large Language Model (LLM). The chart shows a highly skewed distribution, with a very small number of tokens receiving high probability and the vast majority having very low probability.
### Components/Axes
* **Title:** "Probability Distribution over the LLM's Text Tokens" (centered at the top).
* **X-Axis:**
* **Label:** "Tokens Index" (centered below the axis).
* **Scale:** Linear scale from 0 to approximately 130,000.
* **Major Tick Marks:** 0, 20000, 40000, 60000, 80000, 100000, 120000.
* **Y-Axis:**
* **Label:** "Probability" (centered to the left of the axis, rotated 90 degrees).
* **Scale:** Linear scale from 0.000 to 0.012.
* **Major Tick Marks:** 0.000, 0.002, 0.004, 0.006, 0.008, 0.010, 0.012.
* **Data Series:** A single series represented by light blue vertical bars. There is no legend, as only one data category is plotted.
* **Spatial Layout:** The chart occupies the central area of the image. The title is at the top-center. The y-axis label is on the left, and the x-axis label is at the bottom-center. The data bars originate from the x-axis (y=0).
### Detailed Analysis
* **Trend Verification:** The visual trend is an extremely sharp decline. A single, very tall bar is present at the far left (lowest token index). Following this peak, the bar heights drop dramatically and remain consistently low across the rest of the x-axis, with minor, random-looking fluctuations.
* **Key Data Points (Approximate):**
* **Peak Probability:** The highest bar is located at or very near Token Index 0. Its height reaches approximately **0.0118** (just below the 0.012 mark).
* **Secondary Peaks:** A few other bars in the very low index range (0-5000) show noticeable but much smaller peaks, with probabilities around **0.002 to 0.003**.
* **General Distribution:** For the vast majority of token indices (from ~5,000 to ~130,000), the probability values are very low, mostly fluctuating between **0.000 and 0.002**. Many bars are near zero, with occasional spikes rarely exceeding **0.0025**.
### Key Observations
1. **Extreme Skew:** The distribution is dominated by a single, massive outlier at the beginning of the token index. This indicates that one or a very small set of tokens (likely common words, punctuation, or special control tokens like `` or space) are assigned a disproportionately high probability by the model.
2. **Long Tail:** After the initial peak, the distribution exhibits a "long tail" where thousands of tokens have non-zero but very low probabilities. This is characteristic of language, where a few words are extremely common, and a vast vocabulary of less common words exists.
3. **Sparsity and Noise:** The tail appears noisy and sparse, with probabilities jumping up and down without a smooth pattern. This suggests that within the long tail, the model's confidence varies significantly from one token to the next, likely based on the specific context provided when this distribution was generated.
4. **Vocabulary Size:** The x-axis extends to just beyond 120,000, suggesting the LLM's vocabulary size is in the range of **128,000 to 130,000 tokens**.
### Interpretation
This chart provides a visual confirmation of fundamental principles in natural language processing and LLM behavior:
* **Zipf's Law in Action:** The distribution strongly resembles a Zipfian distribution, a power law frequently observed in language corpora where the frequency of a word is inversely proportional to its rank. The highest-ranked token (index 0) is vastly more probable than the 1000th-ranked token.
* **Model Behavior Insight:** The single dominant peak suggests the model has learned that, in the absence of strong contextual cues, it is safest to predict a very common token (like a space or a period). The long, low-probability tail represents the model's nuanced understanding that many other words are possible, but far less likely without specific context.
* **Implications for Generation:** This distribution explains why LLM text generation can sometimes feel generic or repetitive—the model is inherently biased towards a small set of high-probability tokens. Techniques like temperature sampling or top-k/top-p filtering are used to manipulate this raw distribution to encourage more diverse and creative outputs by down-weighting the dominant peak and sampling more from the long tail.
* **Technical Context:** The chart likely represents the model's output probability distribution for a *single* prediction step (the next token) given a specific input prompt. The exact shape would change dramatically with different input contexts.