## Scatter Plot: Performance vs. Decoding Speed of LLMs with Retrieval
### Overview
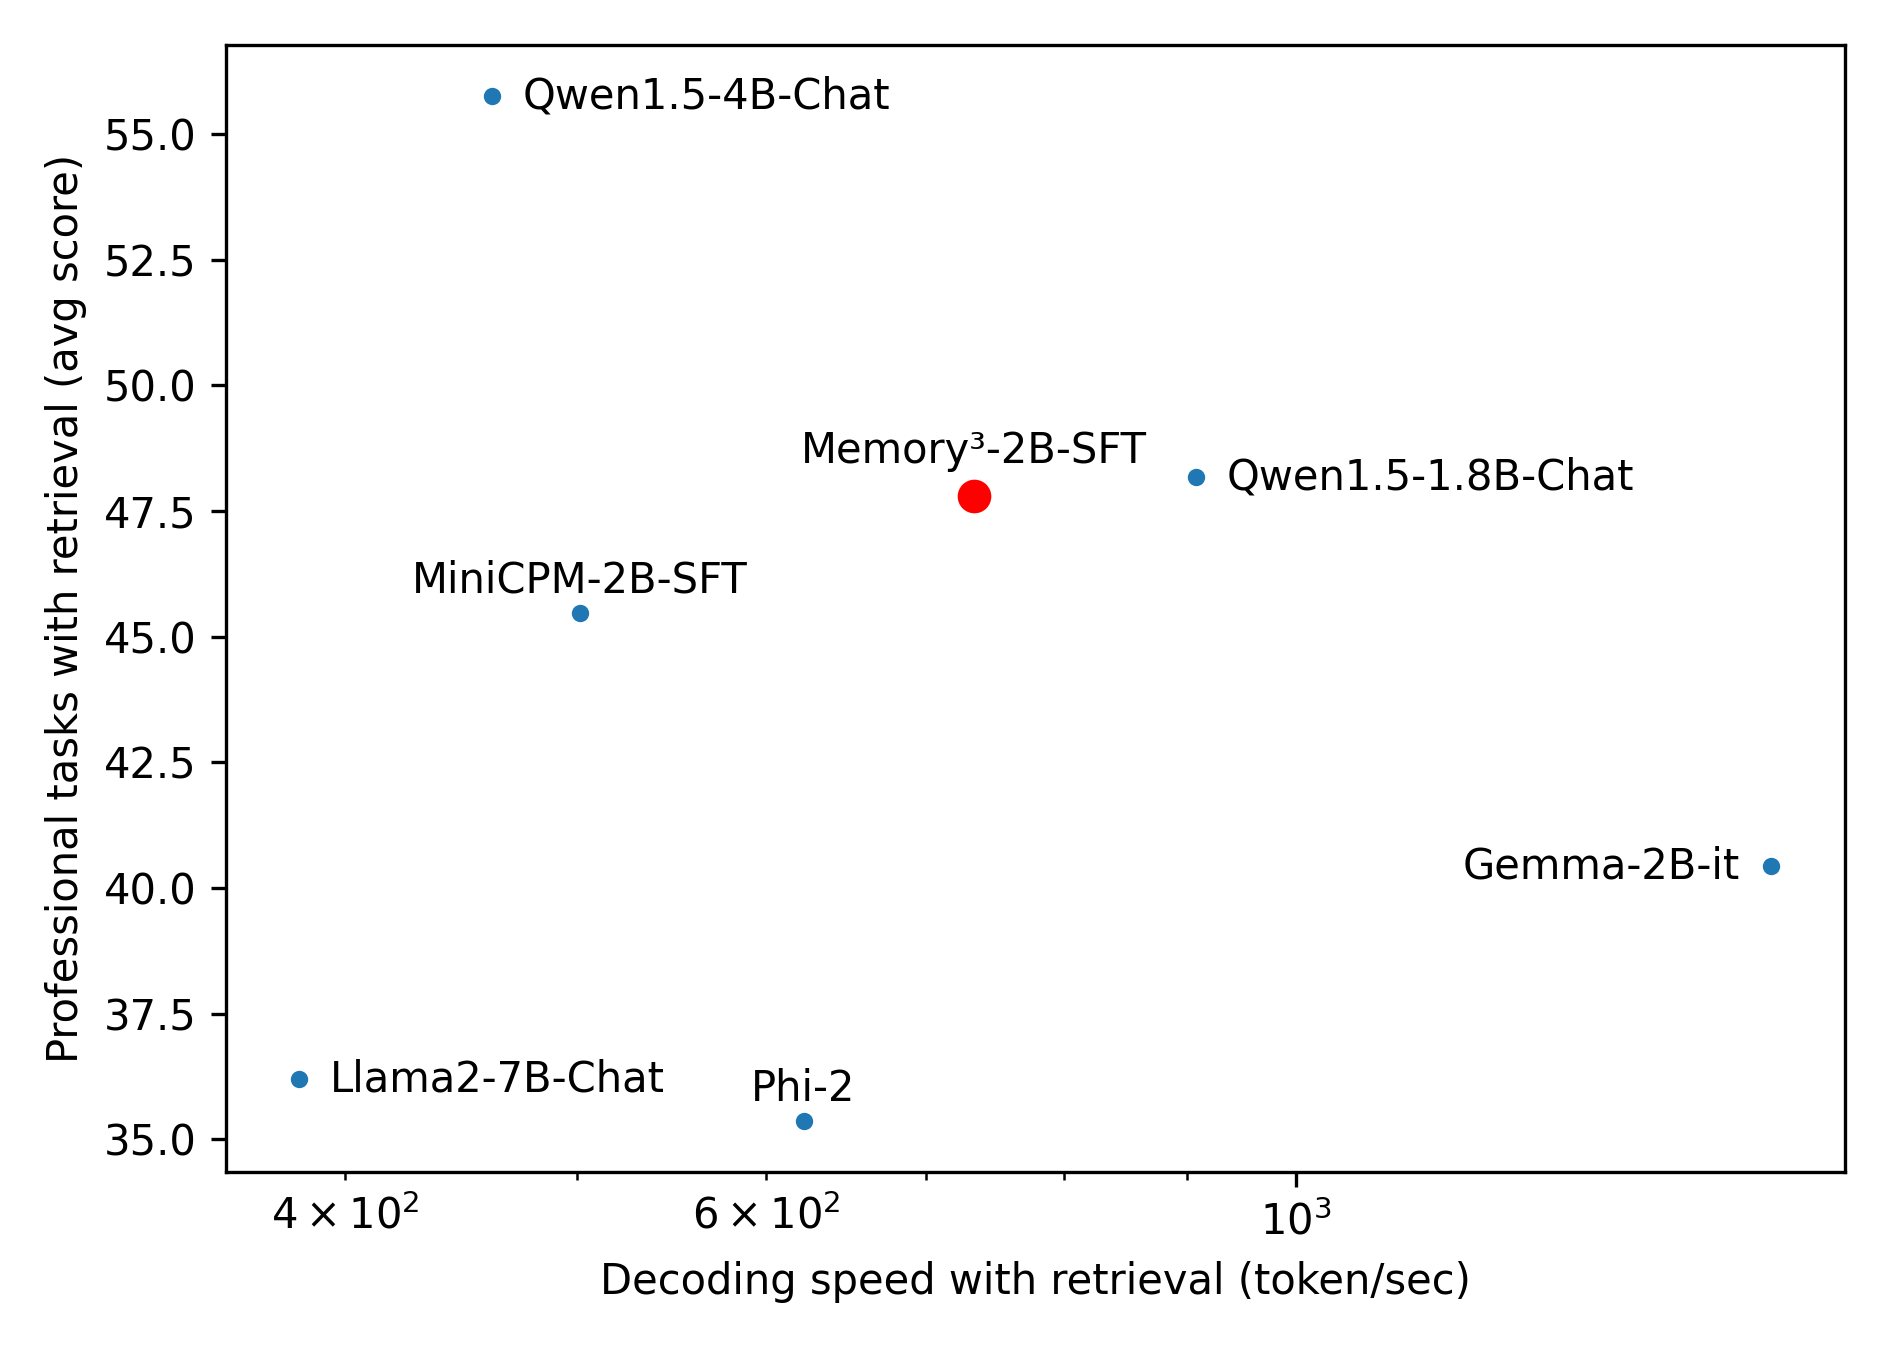
This image is a scatter plot comparing the performance of seven different Large Language Models (LLMs) on professional tasks against their decoding speed when using retrieval mechanisms. The chart highlights one specific model, "Memory³-2B-SFT," using a distinct color and size, suggesting it is the primary subject of the analysis. The data illustrates the trade-off space between generation speed and task accuracy.
### Components/Axes
**Component Isolation:**
1. **Y-Axis (Left):** Represents task performance.
* **Label:** "Professional tasks with retrieval (avg score)"
* **Scale:** Linear.
* **Markers:** 35.0, 37.5, 40.0, 42.5, 45.0, 47.5, 50.0, 52.5, 55.0.
* **Orientation:** Bottom to Top (Lower scores at the bottom, higher scores at the top).
2. **X-Axis (Bottom):** Represents generation speed.
* **Label:** "Decoding speed with retrieval (token/sec)"
* **Scale:** Logarithmic.
* **Markers:** $4 \times 10^2$ (400), $6 \times 10^2$ (600), $10^3$ (1000).
* **Orientation:** Left to Right (Slower speeds on the left, faster speeds on the right).
3. **Main Chart Area:** Contains seven data points.
* **Implicit Legend:** Six points are small blue circles representing baseline or competitor models. One point is a larger red circle representing the highlighted model ("Memory³-2B-SFT").
### Detailed Analysis
*Trend Verification:* Because this is a scatter plot, there is no single continuous line. However, observing the overall distribution, there is no strict linear correlation. Models are scattered across the quadrants, demonstrating a complex trade-off landscape where higher speed does not strictly guarantee lower or higher scores. The ideal position on this chart is the top-right (high score, high speed).
Below are the extracted data points, utilizing spatial grounding and approximate values (with an estimated uncertainty of $\pm 5\%$ due to visual interpolation on a log scale for the X-axis).
* **Llama2-7B-Chat**
* **Position:** Bottom-left.
* **Visual:** Small blue dot. Label is to the right of the dot.
* **X (Speed):** ~390 tokens/sec (just left of the $4 \times 10^2$ marker).
* **Y (Score):** ~36.2 (slightly above the 35.0 line).
* **Qwen1.5-4B-Chat**
* **Position:** Top-left.
* **Visual:** Small blue dot. Label is to the right of the dot.
* **X (Speed):** ~450 tokens/sec.
* **Y (Score):** ~55.8 (highest on the chart, above the 55.0 line).
* **MiniCPM-2B-SFT**
* **Position:** Mid-left.
* **Visual:** Small blue dot. Label is above the dot.
* **X (Speed):** ~500 tokens/sec.
* **Y (Score):** ~45.5 (slightly above the 45.0 line).
* **Phi-2**
* **Position:** Bottom-center.
* **Visual:** Small blue dot. Label is above the dot.
* **X (Speed):** ~620 tokens/sec (just right of the $6 \times 10^2$ marker).
* **Y (Score):** ~35.4 (lowest on the chart, slightly above the 35.0 line).
* **Memory³-2B-SFT**
* **Position:** Center.
* **Visual:** Large red dot. Label is above the dot.
* **X (Speed):** ~750 tokens/sec (between $6 \times 10^2$ and $10^3$).
* **Y (Score):** ~47.8 (slightly above the 47.5 line).
* **Qwen1.5-1.8B-Chat**
* **Position:** Mid-right.
* **Visual:** Small blue dot. Label is to the right of the dot.
* **X (Speed):** ~850 tokens/sec (closer to $10^3$ than the red dot).
* **Y (Score):** ~48.2 (slightly above the red dot).
* **Gemma-2B-it**
* **Position:** Bottom-right.
* **Visual:** Small blue dot. Label is to the left of the dot.
* **X (Speed):** ~1600 tokens/sec (far right, well past the $10^3$ marker).
* **Y (Score):** ~40.4 (slightly above the 40.0 line).
### Key Observations
1. **Outliers:**
* **Qwen1.5-4B-Chat** is a significant outlier in terms of performance (highest score by a wide margin) but is among the slowest models.
* **Gemma-2B-it** is a significant outlier in terms of speed (fastest by a wide margin) but has a relatively mediocre score.
2. **Clustering:** There is a loose cluster of ~2B parameter models (MiniCPM, Memory³, Qwen1.5-1.8B) operating in the middle ranges of both speed (500-850 tokens/sec) and score (45-48).
3. **Size vs. Performance Anomaly:** The largest model shown, Llama2-7B-Chat, performs poorly in both speed and score compared to much smaller ~2B models, indicating older architecture or less effective retrieval integration.
### Interpretation
This chart is designed to showcase the efficacy of the **Memory³-2B-SFT** model (highlighted in red). By reading between the lines of the data presentation, several conclusions can be drawn about the author's intent:
* **Competitive Positioning:** The chart demonstrates that Memory³-2B-SFT occupies a highly favorable position on the Pareto frontier for models in the ~2B parameter class.
* **Direct Comparisons:**
* It completely dominates older/larger models like Llama2-7B-Chat (it is both faster and much more accurate).
* Compared to its direct size peers (MiniCPM-2B, Phi-2), it is significantly faster and achieves higher scores.
* It achieves near parity in score with Qwen1.5-1.8B-Chat, though it is slightly slower.
* While Gemma-2B-it is much faster, Memory³-2B-SFT offers a substantially higher professional task score (~47.8 vs ~40.4), suggesting it is better suited for tasks requiring accuracy over raw speed.
* **The "Sweet Spot":** The visual placement of the red dot near the center of the graph visually communicates balance. It suggests that while you can get higher scores (Qwen 4B) or faster speeds (Gemma 2B), Memory³-2B-SFT provides the best practical compromise of both metrics for professional retrieval tasks.