## Scatter Plot: Professional Tasks vs. Decoding Speed with Retrieval
### Overview
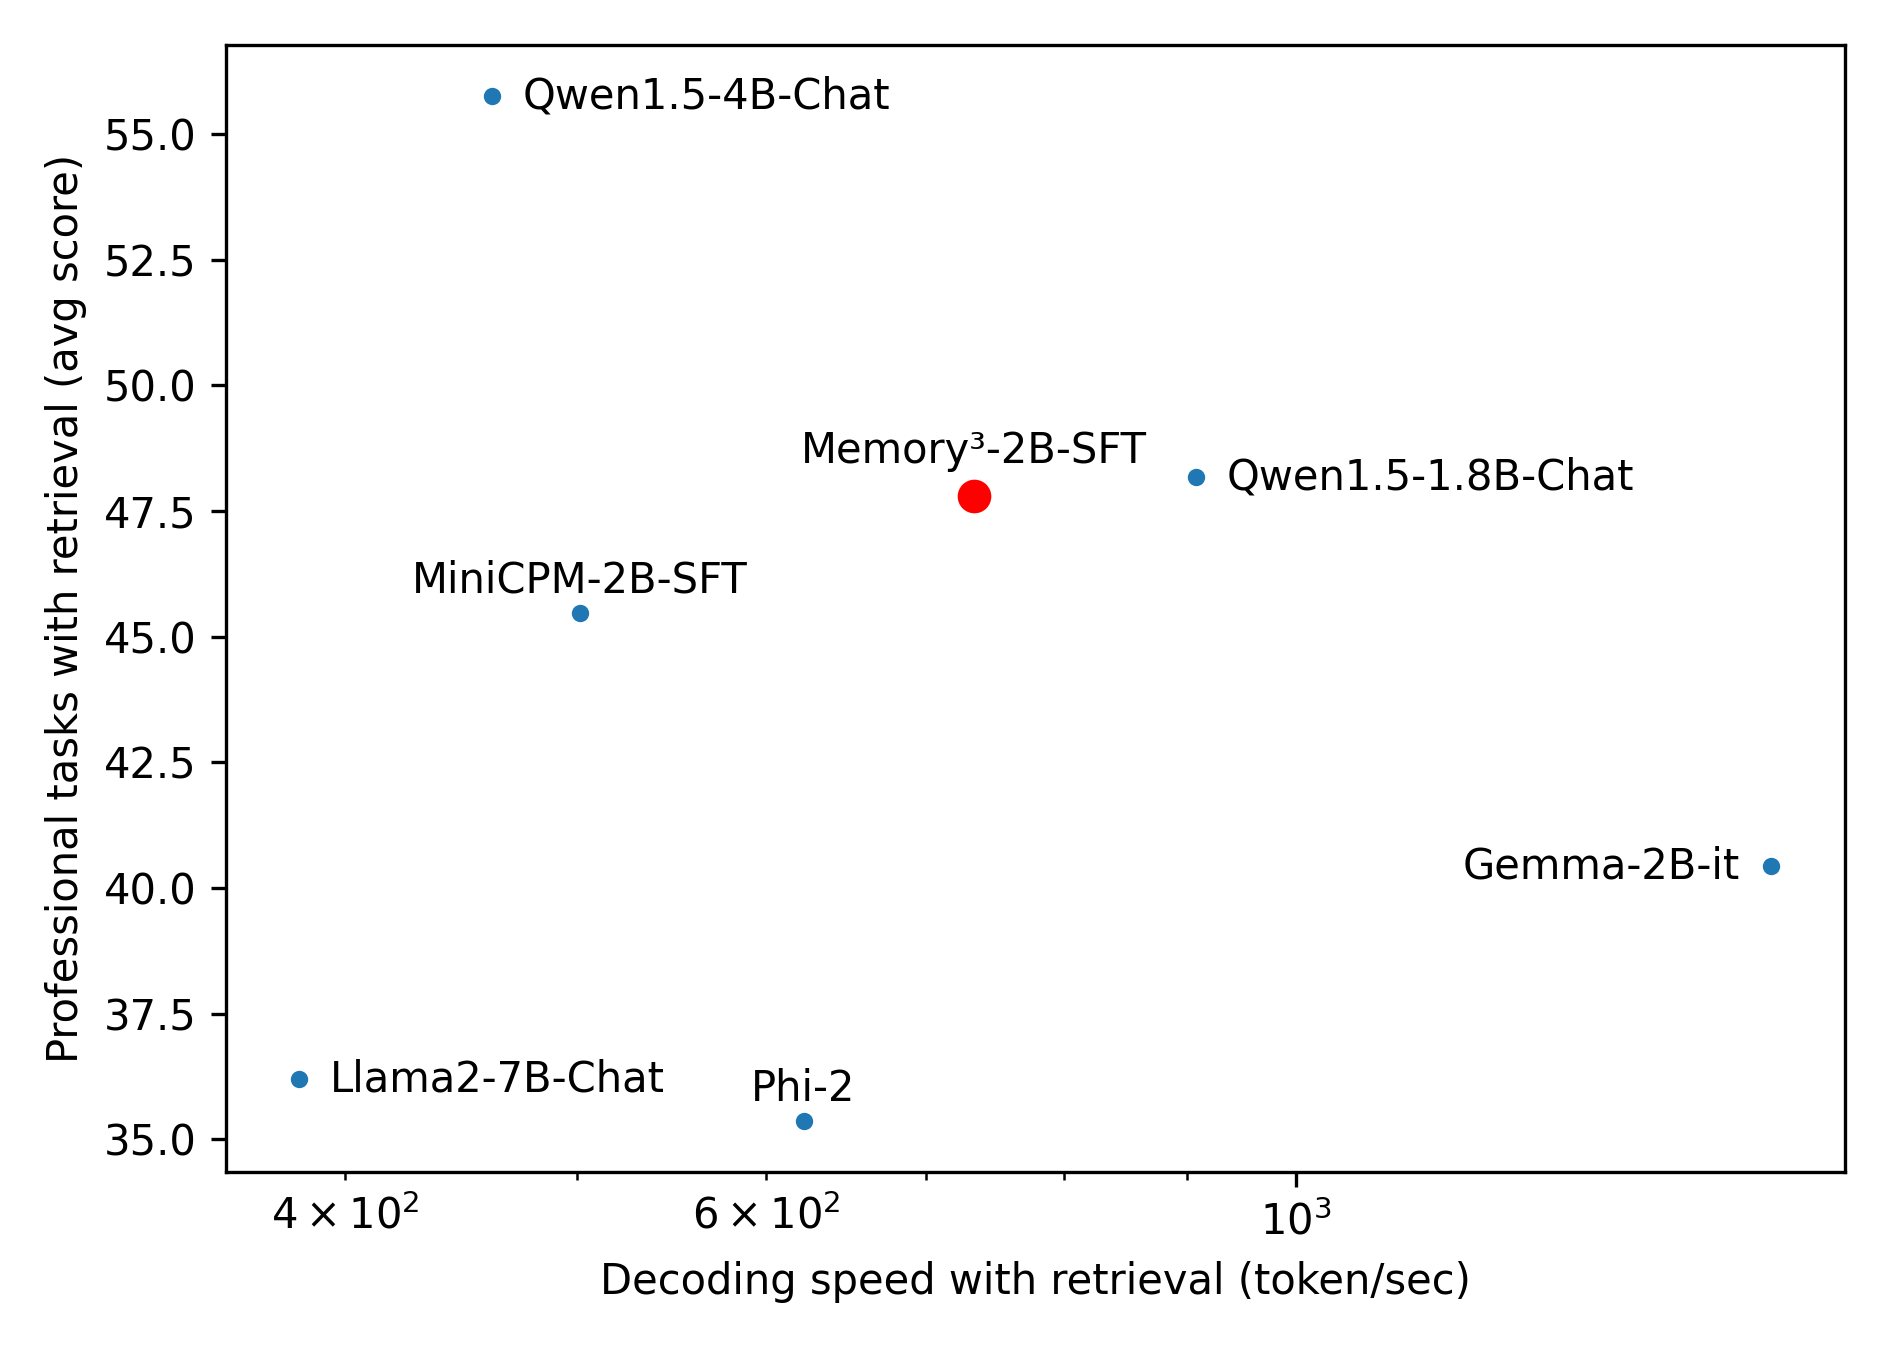
The image is a scatter plot comparing the performance of several language models on professional tasks with retrieval against their decoding speed with retrieval. The y-axis represents the average score on professional tasks, while the x-axis represents the decoding speed in tokens per second. Each data point represents a different language model.
### Components/Axes
* **Title:** There is no explicit title.
* **X-axis:** Decoding speed with retrieval (token/sec). The scale is logarithmic. Markers are at 4 x 10^2, 6 x 10^2, and 10^3.
* **Y-axis:** Professional tasks with retrieval (avg score). The scale is linear, ranging from 35.0 to 55.0, with tick marks at intervals of 2.5.
* **Data Points:** Each model is represented by a dot and a label. The models are:
* Qwen1.5-4B-Chat (blue)
* Memory³-2B-SFT (red)
* Qwen1.5-1.8B-Chat (blue)
* MiniCPM-2B-SFT (blue)
* Gemma-2B-it (blue)
* Llama2-7B-Chat (blue)
* Phi-2 (blue)
### Detailed Analysis
* **Qwen1.5-4B-Chat:** Located at approximately (400, 56.5).
* **Memory³-2B-SFT:** Located at approximately (700, 48). This point is colored red.
* **Qwen1.5-1.8B-Chat:** Located at approximately (950, 48).
* **MiniCPM-2B-SFT:** Located at approximately (480, 46).
* **Gemma-2B-it:** Located at approximately (1100, 40.5).
* **Llama2-7B-Chat:** Located at approximately (400, 36.5).
* **Phi-2:** Located at approximately (620, 35.5).
### Key Observations
* Qwen1.5-4B-Chat has the highest average score on professional tasks with retrieval.
* Llama2-7B-Chat and Phi-2 have the lowest average scores.
* Gemma-2B-it has the highest decoding speed among the models shown.
* Memory³-2B-SFT is highlighted in red, possibly indicating a point of interest or comparison.
### Interpretation
The scatter plot visualizes the trade-off between performance on professional tasks and decoding speed for different language models. Models like Qwen1.5-4B-Chat excel in task performance but may have lower decoding speeds compared to models like Gemma-2B-it. The red data point, Memory³-2B-SFT, might represent a baseline model or a model with a specific characteristic being compared against the others. The plot suggests that there is no single model that dominates in both performance and speed, and the choice of model depends on the specific application requirements.