## Scatter Plot: Decoding Speed vs. Professional Task Performance
### Overview
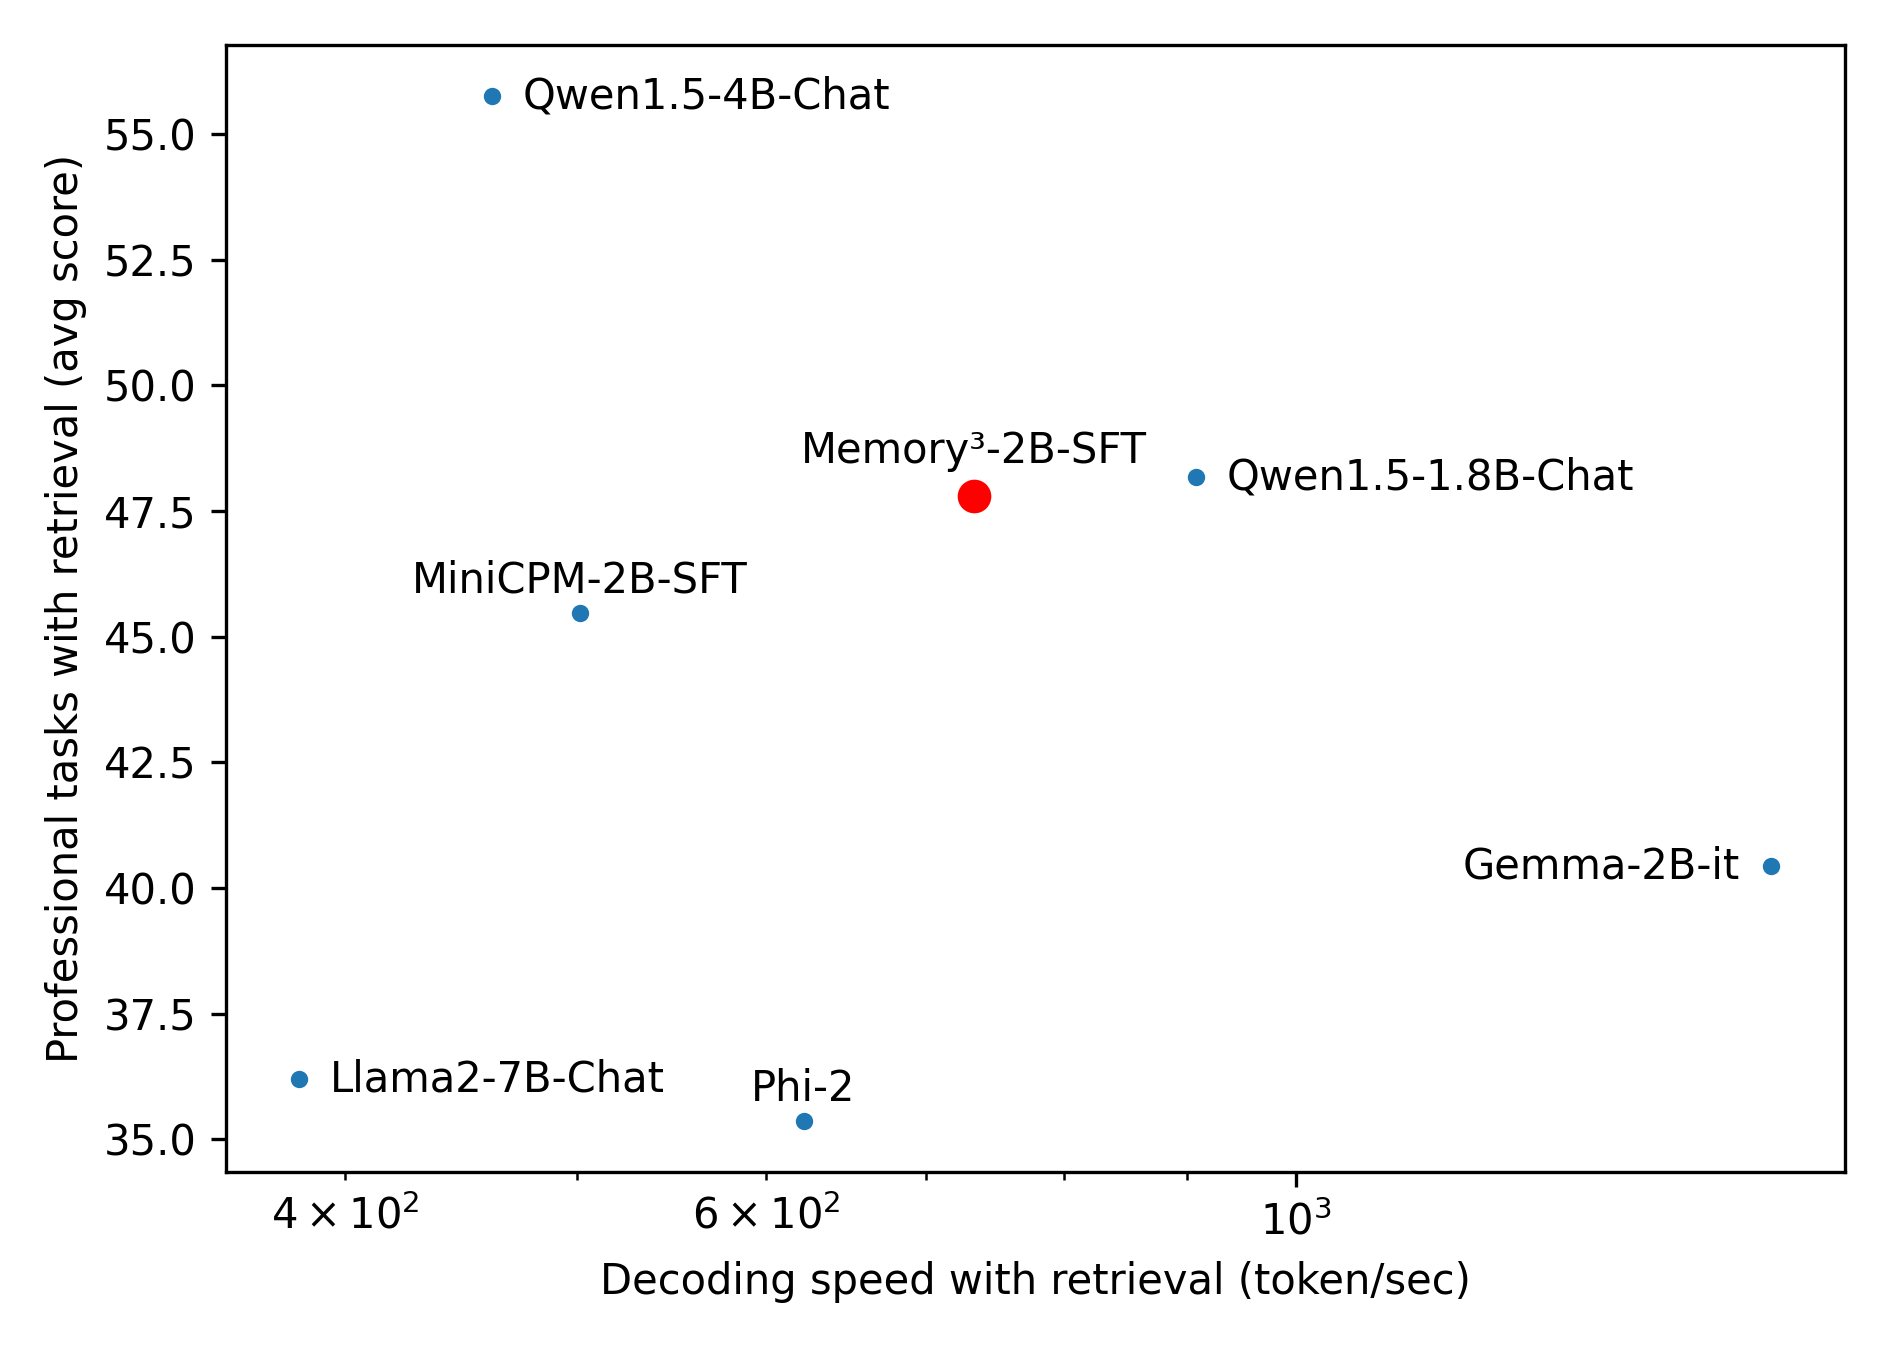
The image is a scatter plot comparing the decoding speed (tokens/second) and professional task performance (average score) of various AI models. Data points are color-coded by model type, with annotations for specific models. The plot highlights trade-offs between computational efficiency and task accuracy.
### Components/Axes
- **X-axis**: Decoding speed with retrieval (token/sec)
- Scale: Logarithmic (4×10² to 10³)
- Labels: 4×10², 6×10², 10³
- **Y-axis**: Professional tasks with retrieval (avg score)
- Scale: Linear (35 to 55)
- Labels: 35, 37.5, 40, 42.5, 45, 47.5, 50, 52.5, 55
- **Legend**:
- Blue: Qwen1.5-4B-Chat, Qwen1.5-1.8B-Chat, Llama2-7B-Chat, Phi-2, Gemma-2B-it
- Red: Memory³-2B-SFT
- Position: Top-left corner
### Detailed Analysis
1. **Data Points**:
- **Qwen1.5-4B-Chat**: (450, 56) – Highest y-value, moderate x-value.
- **Memory³-2B-SFT**: (700, 48) – Red dot, mid-range x and y.
- **Qwen1.5-1.8B-Chat**: (900, 48) – High x-value, moderate y.
- **Gemma-2B-it**: (1000, 40) – Highest x-value, lowest y.
- **MiniCPM-2B-SFT**: (550, 45) – Mid-range x, lower y.
- **Llama2-7B-Chat**: (400, 36) – Low x and y.
- **Phi-2**: (600, 35) – Mid x, lowest y.
2. **Trends**:
- No clear linear correlation between decoding speed and task performance.
- Higher decoding speeds (e.g., Gemma-2B-it) often correspond to lower task scores.
- Qwen1.5-4B-Chat achieves the highest task score despite moderate decoding speed.
### Key Observations
- **Outliers**:
- Qwen1.5-4B-Chat (56 score) and Memory³-2B-SFT (48 score) deviate from the trend of lower scores at higher speeds.
- Gemma-2B-it (40 score) has the highest decoding speed but the lowest task performance.
- **Clustering**:
- Models with decoding speeds <600 tokens/sec cluster between 35–48 scores.
- Models >700 tokens/sec show scores between 40–48.
### Interpretation
The plot suggests a **trade-off between decoding speed and task performance**: faster models (e.g., Gemma-2B-it) often sacrifice accuracy, while slower models (e.g., Qwen1.5-4B-Chat) achieve higher scores. The red dot (Memory³-2B-SFT) represents a balanced middle ground. The logarithmic x-axis emphasizes differences in speed across orders of magnitude, while the linear y-axis highlights incremental score variations. This visualization underscores the complexity of optimizing AI models for both efficiency and effectiveness.