## Radar Chart: Performance Comparison
### Overview
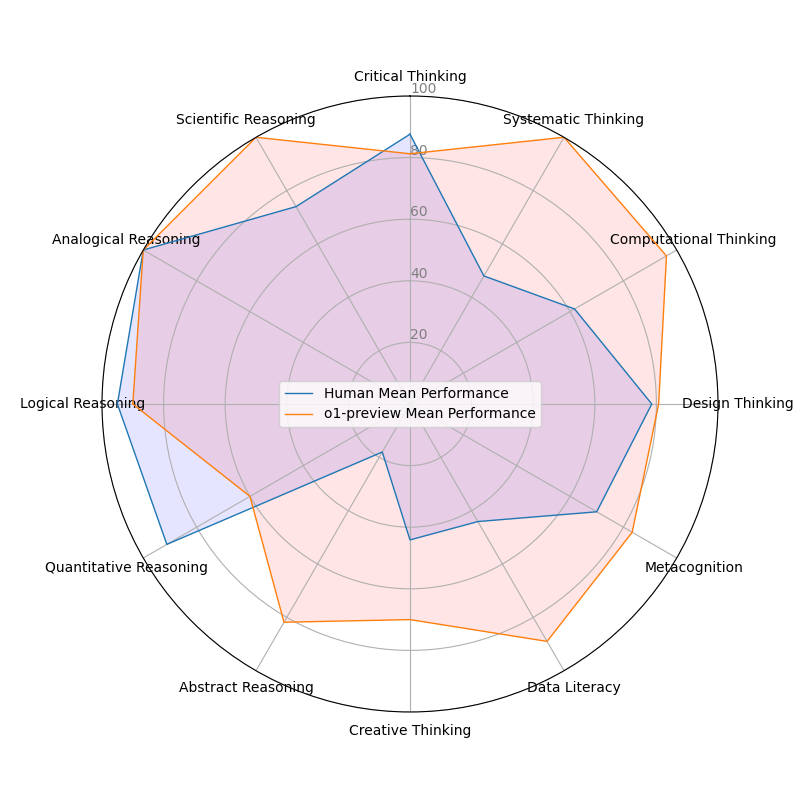
The image is a radar chart comparing "Human Mean Performance" and "o1-preview Mean Performance" across various cognitive skills. The chart visualizes the relative strengths and weaknesses of each performance type across different categories.
### Components/Axes
* **Axes:** The chart has radial axes representing different cognitive skills.
* **Categories:** The categories are arranged in a circular fashion around the chart. They are:
* Critical Thinking
* Systematic Thinking
* Computational Thinking
* Design Thinking
* Metacognition
* Data Literacy
* Creative Thinking
* Abstract Reasoning
* Quantitative Reasoning
* Logical Reasoning
* Analogical Reasoning
* Scientific Reasoning
* **Scale:** The chart has a numerical scale from 0 to 100, with concentric circles marking increments of 20.
* **Legend:** Located in the center of the chart.
* Blue line: "Human Mean Performance"
* Orange line: "o1-preview Mean Performance"
### Detailed Analysis
* **Human Mean Performance (Blue Line):**
* Critical Thinking: Approximately 82
* Systematic Thinking: Approximately 48
* Computational Thinking: Approximately 30
* Design Thinking: Approximately 25
* Metacognition: Approximately 20
* Data Literacy: Approximately 15
* Creative Thinking: Approximately 12
* Abstract Reasoning: Approximately 18
* Quantitative Reasoning: Approximately 20
* Logical Reasoning: Approximately 50
* Analogical Reasoning: Approximately 75
* Scientific Reasoning: Approximately 80
* **o1-preview Mean Performance (Orange Line):**
* Critical Thinking: Approximately 80
* Systematic Thinking: Approximately 80
* Computational Thinking: Approximately 50
* Design Thinking: Approximately 28
* Metacognition: Approximately 25
* Data Literacy: Approximately 20
* Creative Thinking: Approximately 22
* Abstract Reasoning: Approximately 25
* Quantitative Reasoning: Approximately 30
* Logical Reasoning: Approximately 30
* Analogical Reasoning: Approximately 80
* Scientific Reasoning: Approximately 82
### Key Observations
* "Human Mean Performance" excels in Critical Thinking, Scientific Reasoning, and Analogical Reasoning, showing higher scores compared to "o1-preview Mean Performance" in these areas.
* "o1-preview Mean Performance" shows higher scores in Systematic Thinking, Computational Thinking, and Abstract Reasoning.
* Both performance types show relatively lower scores in Metacognition, Data Literacy, Creative Thinking, Abstract Reasoning, and Quantitative Reasoning.
* The largest performance difference is in Systematic Thinking, where "o1-preview Mean Performance" significantly outperforms "Human Mean Performance".
### Interpretation
The radar chart provides a visual comparison of "Human Mean Performance" and "o1-preview Mean Performance" across a range of cognitive skills. The data suggests that while "Human Mean Performance" is stronger in areas like Critical Thinking and Analogical Reasoning, "o1-preview Mean Performance" demonstrates superior capabilities in Systematic Thinking and Computational Thinking. The chart highlights areas where both performance types are relatively weak, indicating potential areas for improvement. The differences in performance across these skills could be attributed to various factors, such as training, experience, or inherent aptitude. The chart is useful for identifying specific strengths and weaknesses of each performance type, allowing for targeted interventions or strategies to enhance overall cognitive performance.