\n
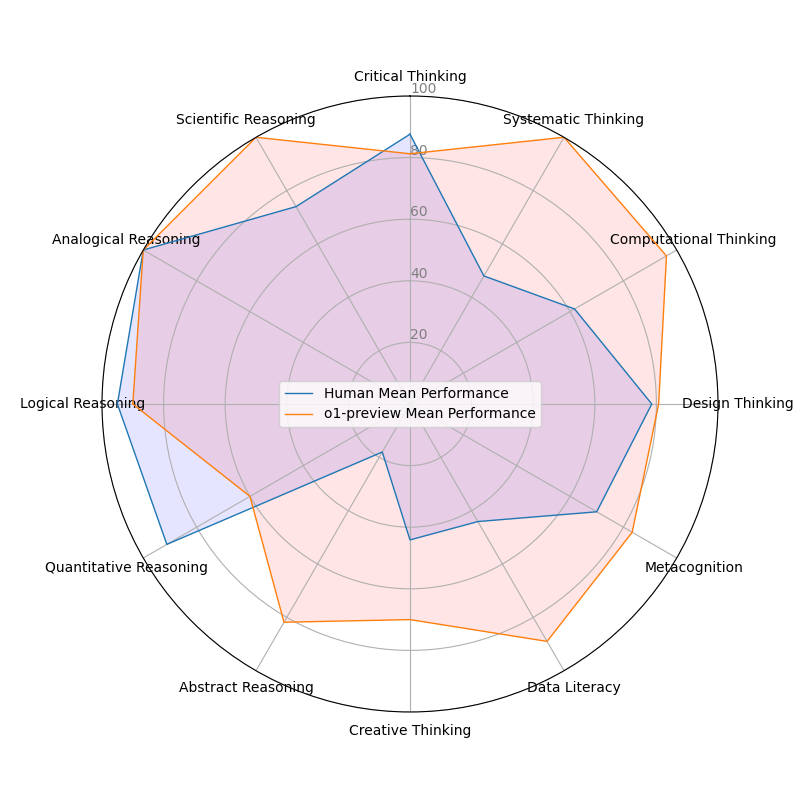
## Radar Chart: Cognitive Skill Comparison
### Overview
This image presents a radar chart comparing the mean performance of humans versus an "o1-preview" model across ten cognitive skills. The chart uses a radial layout with each axis representing a different skill, and the distance from the center indicating the performance score (ranging from 0 to 100). The chart is primarily white with light pink shading to highlight the area covered by the data.
### Components/Axes
* **Axes (Skills):**
* Critical Thinking
* Scientific Reasoning
* Analogical Reasoning
* Logical Reasoning
* Quantitative Reasoning
* Abstract Reasoning
* Creative Thinking
* Data Literacy
* Metacognition
* Design Thinking
* Computational Thinking
* Systematic Thinking
* **Radial Scale:** The scale ranges from 0 to 100, marked at intervals of 20.
* **Legend:** Located in the top-center of the chart.
* Blue Line: "Human Mean Performance"
* Orange Line: "o1-preview Mean Performance"
### Detailed Analysis
The chart displays two polygonal lines representing the performance of humans and the o1-preview model. The lines are plotted against the ten cognitive skills listed above.
* **Human Mean Performance (Blue Line):**
* Critical Thinking: Approximately 75
* Scientific Reasoning: Approximately 65
* Analogical Reasoning: Approximately 60
* Logical Reasoning: Approximately 70
* Quantitative Reasoning: Approximately 60
* Abstract Reasoning: Approximately 50
* Creative Thinking: Approximately 65
* Data Literacy: Approximately 70
* Metacognition: Approximately 60
* Design Thinking: Approximately 55
* Computational Thinking: Approximately 50
* Systematic Thinking: Approximately 60
* **o1-preview Mean Performance (Orange Line):**
* Critical Thinking: Approximately 80
* Scientific Reasoning: Approximately 75
* Analogical Reasoning: Approximately 70
* Logical Reasoning: Approximately 75
* Quantitative Reasoning: Approximately 70
* Abstract Reasoning: Approximately 65
* Creative Thinking: Approximately 70
* Data Literacy: Approximately 75
* Metacognition: Approximately 65
* Design Thinking: Approximately 60
* Computational Thinking: Approximately 60
* Systematic Thinking: Approximately 70
**Trends:**
* The "o1-preview" line generally trends higher than the "Human Mean Performance" line across all skills.
* Both lines exhibit fluctuations, indicating varying levels of performance across different cognitive skills.
* Both lines show a dip in performance for Computational Thinking and Abstract Reasoning.
### Key Observations
* The o1-preview model consistently outperforms humans across all measured cognitive skills.
* The largest performance difference appears to be in Critical Thinking, where the o1-preview model scores approximately 5 points higher.
* The smallest performance difference is in Systematic Thinking, where the o1-preview model scores approximately 10 points higher.
* Both humans and the model show relatively lower scores in Computational Thinking and Abstract Reasoning compared to other skills.
### Interpretation
The radar chart suggests that the o1-preview model demonstrates superior cognitive abilities compared to the average human across a broad range of skills. This could indicate the model's potential for advanced problem-solving, reasoning, and analytical tasks. The consistent outperformance suggests a systematic advantage of the model, rather than isolated skill strengths. The lower scores in Computational Thinking and Abstract Reasoning for both humans and the model might indicate inherent challenges in these areas, or limitations in the assessment methodology. The chart provides a visual comparison of cognitive profiles, highlighting areas where the model excels and areas where further development might be beneficial. The chart is a comparative analysis, and does not provide absolute measures of skill. It is a relative comparison between two entities.