\n
## Radar Chart: Cognitive Skill Performance Comparison
### Overview
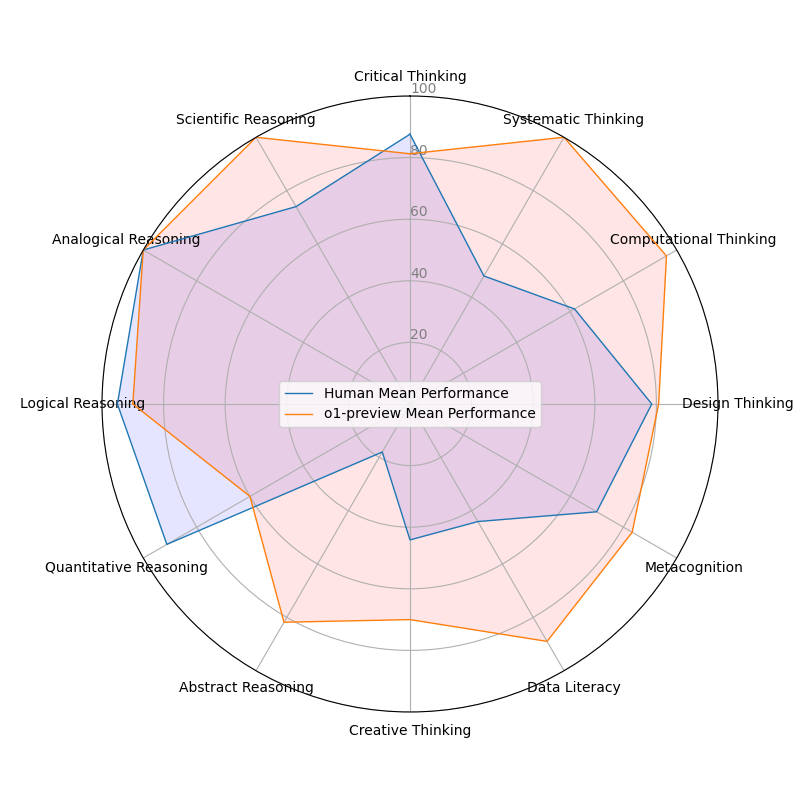
This image is a radar chart (spider chart) comparing the mean performance scores of two groups across twelve distinct cognitive skill categories. The chart uses a circular layout with axes radiating from the center, each representing a different skill. The two data series are "Human Mean Performance" (blue line with a light blue fill) and "o1-preview Mean Performance" (orange line with a light orange fill). The legend is positioned in the center of the chart.
### Components/Axes
* **Chart Type:** Radar Chart (Spider Chart)
* **Title:** Not explicitly stated, but the content compares "Human Mean Performance" vs. "o1-preview Mean Performance".
* **Legend:** Located in the center of the chart.
* Blue line: `Human Mean Performance`
* Orange line: `o1-preview Mean Performance`
* **Axes (12 total, clockwise from top):**
1. Critical Thinking
2. Systematic Thinking
3. Computational Thinking
4. Design Thinking
5. Metacognition
6. Data Literacy
7. Creative Thinking
8. Abstract Reasoning
9. Quantitative Reasoning
10. Logical Reasoning
11. Analogical Reasoning
12. Scientific Reasoning
* **Scale:** Concentric circles represent the score scale, marked at intervals of 20, from 0 at the center to 100 at the outermost ring. The labeled markers are `20`, `40`, `60`, `80`, and `100`.
### Detailed Analysis
**Data Series: Human Mean Performance (Blue Line)**
* **Trend:** The blue polygon is irregular, showing significant variation across skills. It is strongest in logical and quantitative domains and weakest in systematic and computational domains.
* **Approximate Data Points (by axis):**
* Critical Thinking: ~85
* Systematic Thinking: ~55
* Computational Thinking: ~45
* Design Thinking: ~65
* Metacognition: ~60
* Data Literacy: ~50
* Creative Thinking: ~40
* Abstract Reasoning: ~65
* Quantitative Reasoning: ~90
* Logical Reasoning: ~95
* Analogical Reasoning: ~85
* Scientific Reasoning: ~75
**Data Series: o1-preview Mean Performance (Orange Line)**
* **Trend:** The orange polygon is more rounded and expansive, indicating generally higher and more consistent performance across most categories. It shows particular strength in systematic, computational, and design-oriented thinking.
* **Approximate Data Points (by axis):**
* Critical Thinking: ~80
* Systematic Thinking: ~95
* Computational Thinking: ~95
* Design Thinking: ~90
* Metacognition: ~85
* Data Literacy: ~90
* Creative Thinking: ~70
* Abstract Reasoning: ~85
* Quantitative Reasoning: ~75
* Logical Reasoning: ~70
* Analogical Reasoning: ~80
* Scientific Reasoning: ~90
### Key Observations
1. **Performance Crossover:** The two series intersect multiple times. Humans outperform o1-preview in **Logical Reasoning**, **Quantitative Reasoning**, and slightly in **Critical Thinking** and **Analogical Reasoning**. o1-preview outperforms humans in all other categories, with very large gaps in **Systematic Thinking**, **Computational Thinking**, **Design Thinking**, and **Data Literacy**.
2. **Shape Contrast:** The human performance shape is skewed towards the left side of the chart (Logical, Quantitative, Analogical), while the o1-preview shape is more balanced but heavily weighted towards the right and top (Systematic, Computational, Design, Data).
3. **Lowest Common Point:** Both series show their lowest relative performance in **Creative Thinking**, though o1-preview's score (~70) is still significantly higher than the human score (~40).
4. **Highest Scores:** The single highest data point on the chart is for Human performance in **Logical Reasoning** (~95). The highest for o1-preview is a tie between **Systematic Thinking** and **Computational Thinking** (~95).
### Interpretation
This chart visualizes a comparative assessment of cognitive abilities between a human population mean and an AI system ("o1-preview"). The data suggests a complementary profile of strengths:
* **AI Strengths (o1-preview):** The system demonstrates superior performance in structured, rule-based, and systematic domains. Its near-maximum scores in Systematic and Computational Thinking indicate a strong capacity for following complex procedures, algorithmic thinking, and processing structured data. High scores in Design and Data Literacy suggest proficiency in applying frameworks and interpreting information.
* **Human Strengths:** The human profile shows a clear advantage in reasoning tasks that may involve ambiguity, abstraction, and foundational logic. The peak in Logical Reasoning and strong showing in Quantitative and Analogical Reasoning point to strengths in deductive/inductive processes, mathematical fundamentals, and drawing parallels between concepts.
* **The Gap in Creativity:** The notable dip for both groups in Creative Thinking is intriguing. For humans, it may reflect the difficulty of the assessment or a genuine area of challenge. For the AI, it suggests that despite high performance in related areas like Design Thinking, generating novel, non-linear ideas remains a relative weakness compared to its other capabilities.
* **Overall Implication:** The chart does not show one entity as universally "better." Instead, it illustrates a division of cognitive labor. The AI excels at systematic execution and data-intensive tasks, while humans maintain an edge in core reasoning and logical analysis. This could inform how human-AI collaboration is structured, leveraging the AI for systematic processing and humans for oversight, logical validation, and handling abstract analogies.