# Technical Document Extraction: Prediction Sets (80% CI)
## 1. Document Metadata
* **Title:** Prediction Sets (80% CI)
* **Chart Type:** Error Bar Plot (Point estimates with Confidence Intervals)
* **Primary Language:** English
## 2. Component Isolation
### Header
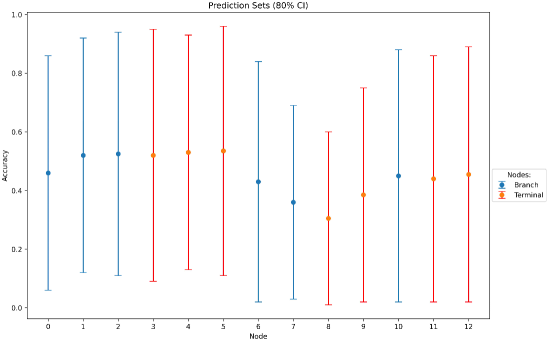
* **Title Text:** "Prediction Sets (80% CI)"
* **Context:** The chart visualizes accuracy metrics across different nodes, likely within a decision tree or hierarchical model, showing the mean accuracy and the 80% Confidence Interval (CI).
### Main Chart Area (Axes and Scales)
* **Y-Axis Label:** Accuracy
* **Y-Axis Scale:** 0.0 to 1.0 (increments of 0.2 marked: 0.0, 0.2, 0.4, 0.6, 0.8, 1.0).
* **X-Axis Label:** Node
* **X-Axis Scale:** Discrete integer values from 0 to 12.
### Legend (Spatial Grounding: [x=0.95, y=0.50])
The legend is located on the center-right exterior of the plot.
* **Legend Title:** Nodes:
* **Category 1:** "Branch" (Represented by a Blue dot with Blue error bars).
* **Category 2:** "Terminal" (Represented by an Orange dot with Red/Brown error bars).
---
## 3. Data Extraction and Trend Verification
### Trend Analysis
* **Branch Nodes (Blue):** These nodes (0, 1, 2, 6, 7, 10) show a fluctuating accuracy. There is an initial slight upward trend (0-2), a significant drop at nodes 6 and 7, and a recovery at node 10.
* **Terminal Nodes (Orange/Red):** These nodes (3, 4, 5, 8, 9, 11, 12) appear in clusters. The first cluster (3-5) shows very stable, high accuracy (~0.53). The second cluster (8-9) shows a sharp dip followed by an increase. The final cluster (11-12) shows a slight upward trend.
### Data Table (Estimated Values)
The following table reconstructs the visual data points. Note: Accuracy values are point estimates (dots), and CI represents the vertical bars.
| Node | Node Type | Color (Point/Bar) | Estimated Accuracy (Mean) | Estimated 80% CI Range |
| :--- | :--- | :--- | :--- | :--- |
| 0 | Branch | Blue / Blue | 0.46 | [0.06, 0.86] |
| 1 | Branch | Blue / Blue | 0.52 | [0.12, 0.92] |
| 2 | Branch | Blue / Blue | 0.53 | [0.11, 0.94] |
| 3 | Terminal | Orange / Red | 0.52 | [0.09, 0.95] |
| 4 | Terminal | Orange / Red | 0.53 | [0.13, 0.93] |
| 5 | Terminal | Orange / Red | 0.54 | [0.11, 0.96] |
| 6 | Branch | Blue / Blue | 0.43 | [0.02, 0.84] |
| 7 | Branch | Blue / Blue | 0.36 | [0.03, 0.69] |
| 8 | Terminal | Orange / Red | 0.31 | [0.01, 0.60] |
| 9 | Terminal | Orange / Red | 0.39 | [0.02, 0.75] |
| 10 | Branch | Blue / Blue | 0.45 | [0.02, 0.88] |
| 11 | Terminal | Orange / Red | 0.44 | [0.02, 0.86] |
| 12 | Terminal | Orange / Red | 0.46 | [0.02, 0.89] |
---
## 4. Technical Observations
* **Variance:** All nodes exhibit extremely wide confidence intervals, spanning approximately 0.6 to 0.8 units of accuracy. This indicates high uncertainty in the prediction sets for every node.
* **Comparative Performance:** Branch nodes 1 and 2, and Terminal nodes 3, 4, and 5 represent the peak accuracy performance (exceeding 0.5).
* **Lowest Performance:** Node 8 (Terminal) represents the lowest mean accuracy at approximately 0.31.
* **Visual Encoding:** The distinction between "Branch" and "Terminal" is made through both the point color (Blue vs. Orange) and the error bar color (Blue vs. Red/Brown), allowing for clear categorization of the model's structural components.