# Technical Document Extraction: Prediction Sets (80% CI) Chart
## Chart Overview
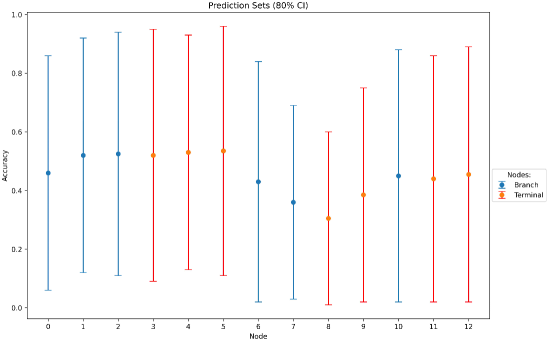
The image depicts a **bar chart** titled **"Prediction Sets (80% CI)"**, visualizing accuracy metrics across 13 nodes (0–12) with 80% confidence intervals (CIs). The chart uses vertical bars with error bars to represent accuracy ranges.
---
### **Axis Labels and Markers**
- **X-Axis**:
- Label: **"Node"**
- Ticks: Numeric values from **0 to 12** (inclusive), evenly spaced.
- **Y-Axis**:
- Label: **"Accuracy"**
- Range: **0.0 to 1.0** (in increments of 0.2).
- Ticks: Marked at **0.0, 0.2, 0.4, 0.6, 0.8, 1.0**.
---
### **Legend**
- **Location**: Right side of the chart.
- **Categories**:
1. **Branch** (Blue)
2. **Terminal** (Orange)
3. **Terminal** (Red)
*Note: Duplicate "Terminal" label with distinct colors (orange and red). This may indicate a data categorization error or intentional differentiation.*
---
### **Data Points and Trends**
#### **Branch Nodes (Blue)**
- **Accuracy**:
- Nodes 0–2: ~0.45–0.55.
- Nodes 6–7: ~0.35–0.45.
- Nodes 10–12: ~0.45–0.55.
- **Error Bars**:
- Longest for Nodes 0, 1, and 2 (~0.15–0.25 range).
- Shortest for Nodes 6 and 7 (~0.05–0.10 range).
#### **Terminal Nodes (Orange)**
- **Accuracy**:
- Nodes 3–5: ~0.50–0.55.
- Nodes 9–12: ~0.40–0.50.
- **Error Bars**:
- Consistent length (~0.10–0.15 range) across all nodes.
#### **Terminal Nodes (Red)**
- **Accuracy**:
- Nodes 3–5: ~0.55–0.65.
- Nodes 9–12: ~0.45–0.55.
- **Error Bars**:
- Longest for Nodes 3–5 (~0.15–0.25 range).
- Shorter for Nodes 9–12 (~0.10–0.15 range).
---
### **Key Observations**
1. **Accuracy Trends**:
- **Red Terminal nodes** (Nodes 3–5) exhibit the highest accuracy (~0.55–0.65) but with the largest variability (longest error bars).
- **Branch nodes** (Nodes 0–2, 6–7, 10–12) show moderate accuracy (~0.45–0.55) with moderate variability.
- **Orange Terminal nodes** (Nodes 3–5, 9–12) have lower accuracy than red Terminal nodes but similar variability.
2. **Confidence Intervals**:
- The 80% CI error bars indicate that predictions for **red Terminal nodes (3–5)** are less reliable due to wider intervals.
3. **Legend Consistency**:
- Colors in the legend (**blue, orange, red**) match the corresponding data series in the chart.
---
### **Spatial Grounding**
- **Legend Position**: Right-aligned, outside the main chart area.
- **Data Point Alignment**:
- Blue (Branch) and orange (Terminal) bars are shorter and clustered lower on the y-axis.
- Red (Terminal) bars are taller, peaking at Nodes 3–5.
---
### **Conclusion**
The chart highlights differences in prediction accuracy and reliability across node types. Red Terminal nodes (3–5) achieve higher accuracy but with greater uncertainty, while Branch and orange Terminal nodes show more consistent but lower performance. The duplicate "Terminal" label in the legend warrants further clarification in the data source.